
Where Winning Lives: The Texas A&M Story
The Anatomy of a Statistical Heist

In the world of sports modeling, Nebraska was a settled argument.
The Huskers entered the 2025 tournament as a juggernaut. They were 33-0. They had lost exactly seven sets all year.
If you were looking for a flaw in their armor, you were looking for a ghost.
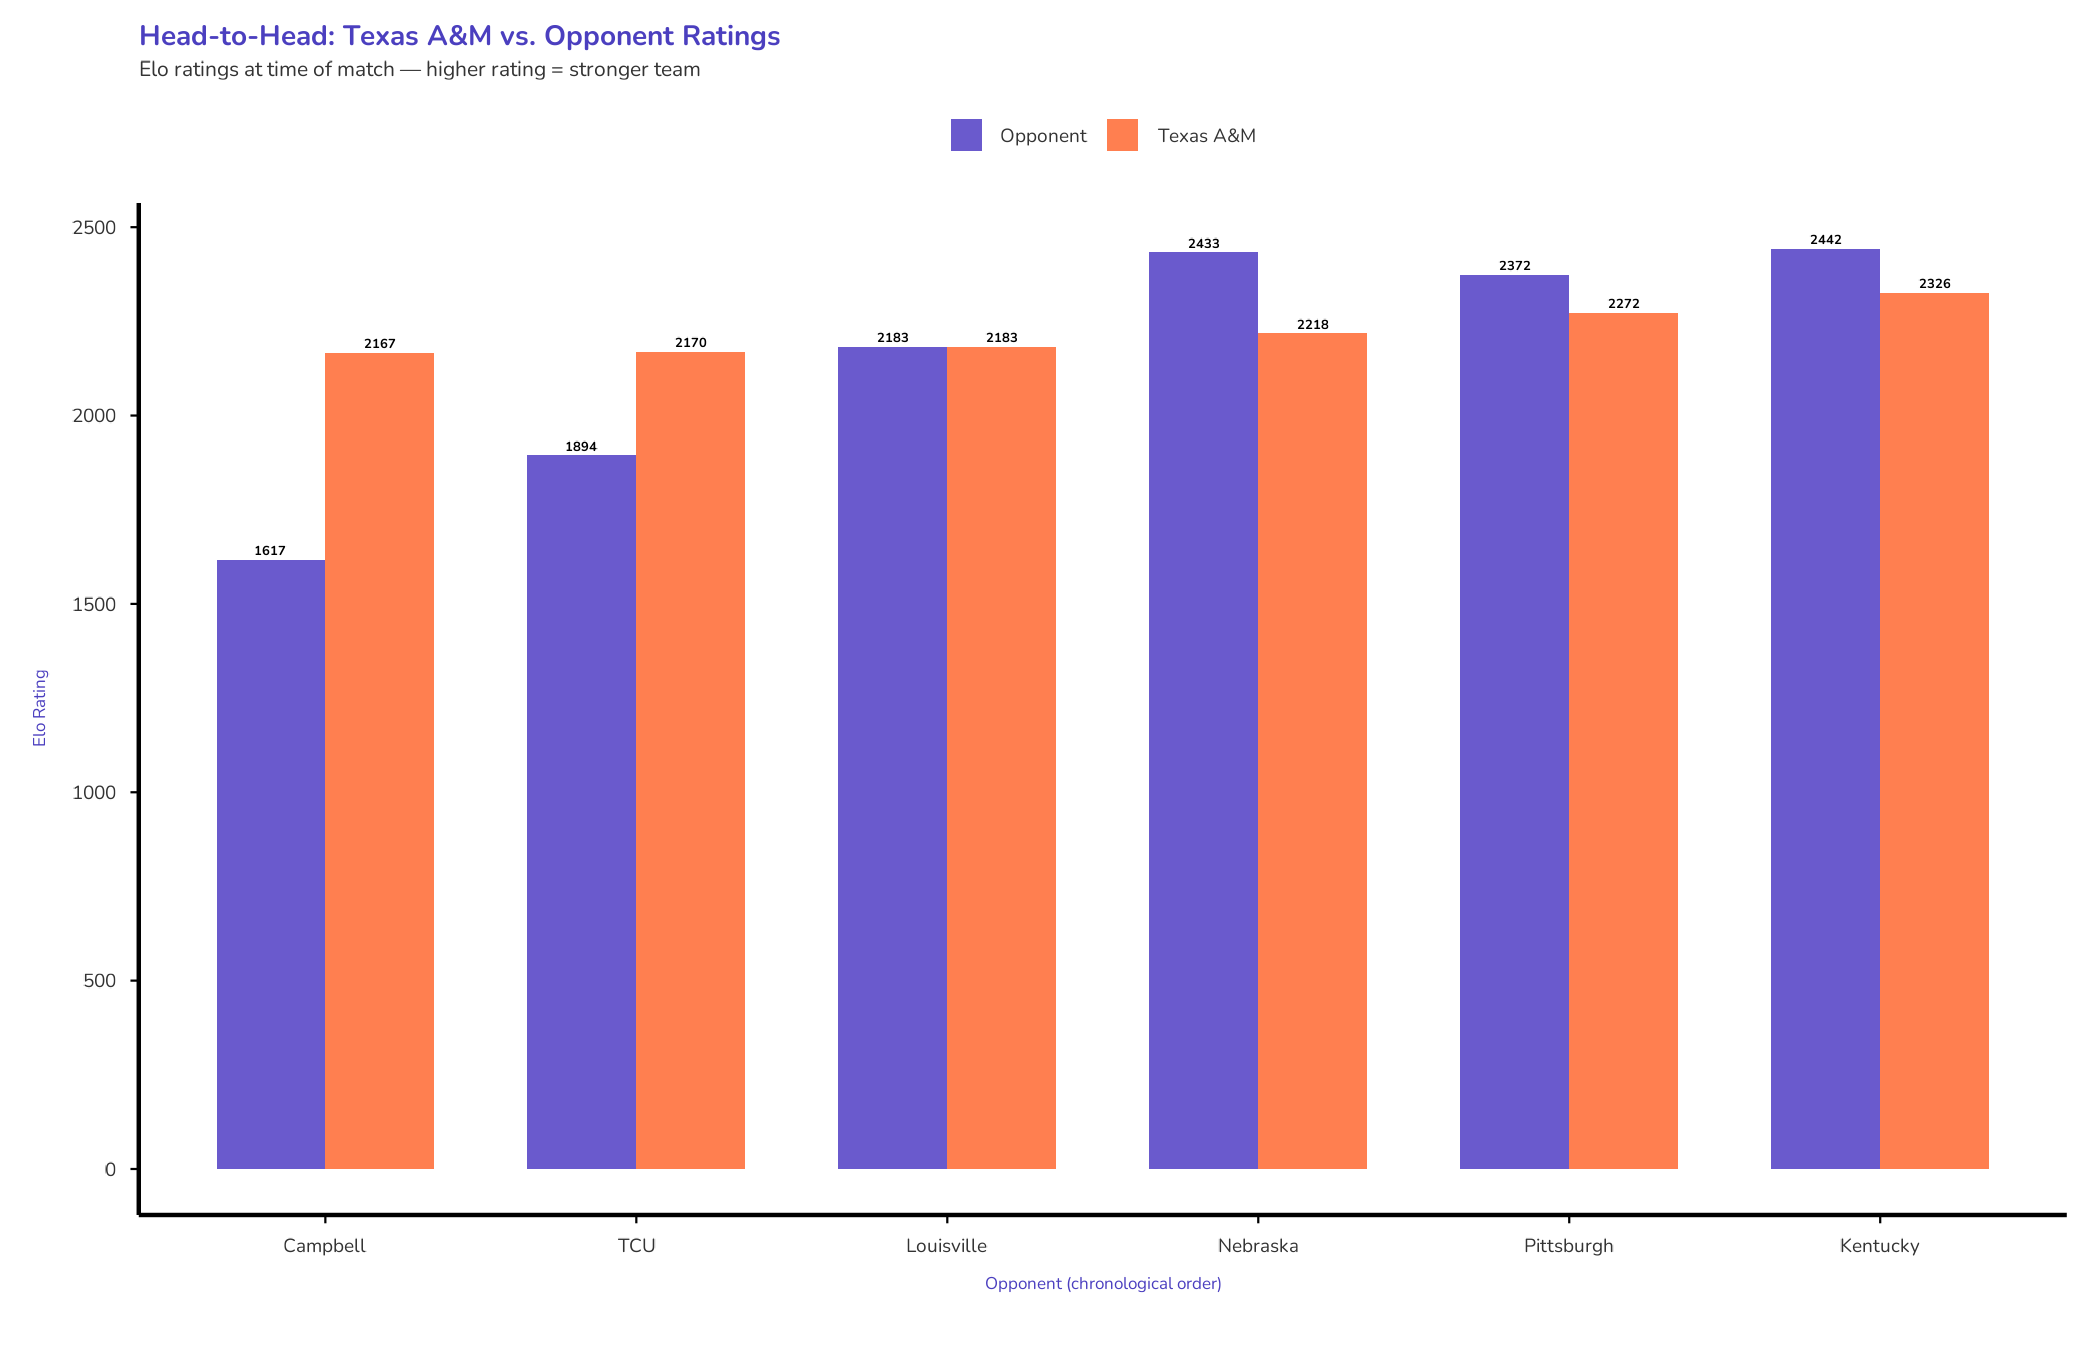
When they met Texas A&M in the Elite Eight, the math wasn’t just skeptical. It was dismissive. Nebraska sat at an Elo peak of 2433. A&M was a distant 2218.
That’s a 215-point chasm. In the cold language of win probability, the Aggies had a 22% chance of surviving the night.
Then, A&M won.
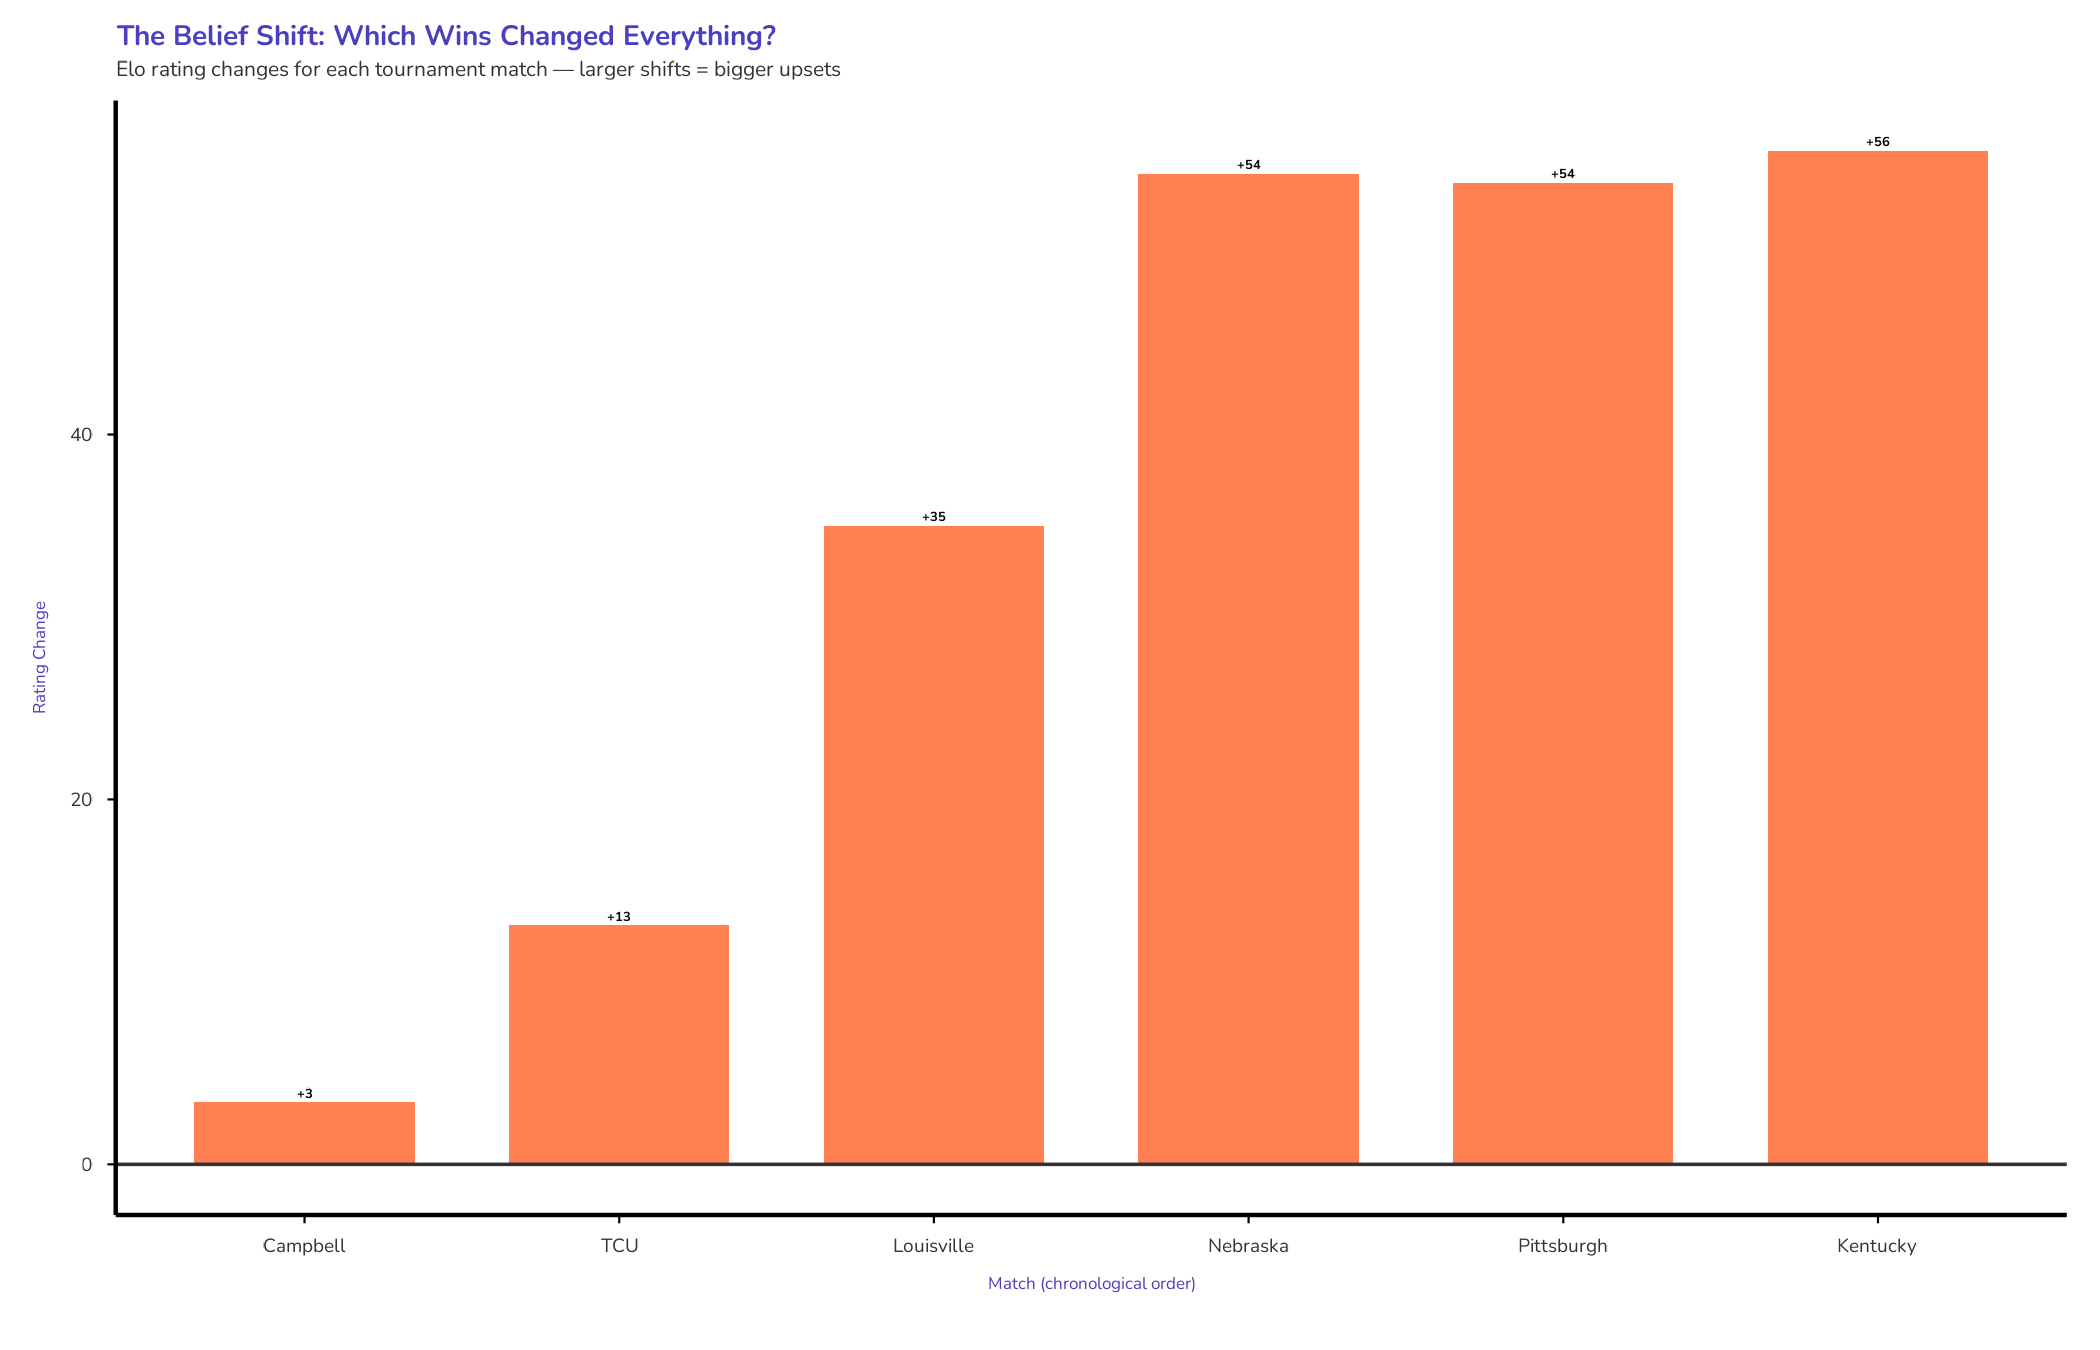
The model didn’t just nudge the needle. It recoiled. That single result forced a 54-point Elo shift—the analytical equivalent of a sharp intake of breath.
But this wasn’t a fluke. It was a heist.
A&M didn’t just play the spoiler; they became a sustained anomaly. They beat three straight 1-seeds as the underdog. By the time the final whistle blew, they were the undisputed champions.
Even as the trophy headed to College Station, the model was still playing catch-up. A&M’s rating surged to 2382, but it still trailed Kentucky—the team they’d just beaten for the title—at 2387.
Elo isn’t a crystal ball. It’s a ledger of evidence. It doesn’t care about “grit” until that grit shows up on the floor as a point.
The Texas A&M run is a case study in how we update our beliefs. It’s the story of a team that stopped asking for permission and started dictating the geometry of the court.
Where They Started
Texas A&M’s season didn’t telegraph a championship.
They started well enough. Early wins pushed their Elo rating above 2000 by late August. The trajectory looked sustainable, if unspectacular.
Then mid-September arrived with a correction.
SMU swept them 3-0. The next day, TCU took them down 3-2. Back-to-back losses, and the model responded accordingly. A&M’s rating cratered from just over 2000 into the low 1900s.
Elo doesn’t care about context. It updates on results. Lose to good teams, the rating drops. Lose badly, it drops faster.
What happened next was quieter, but more revealing.
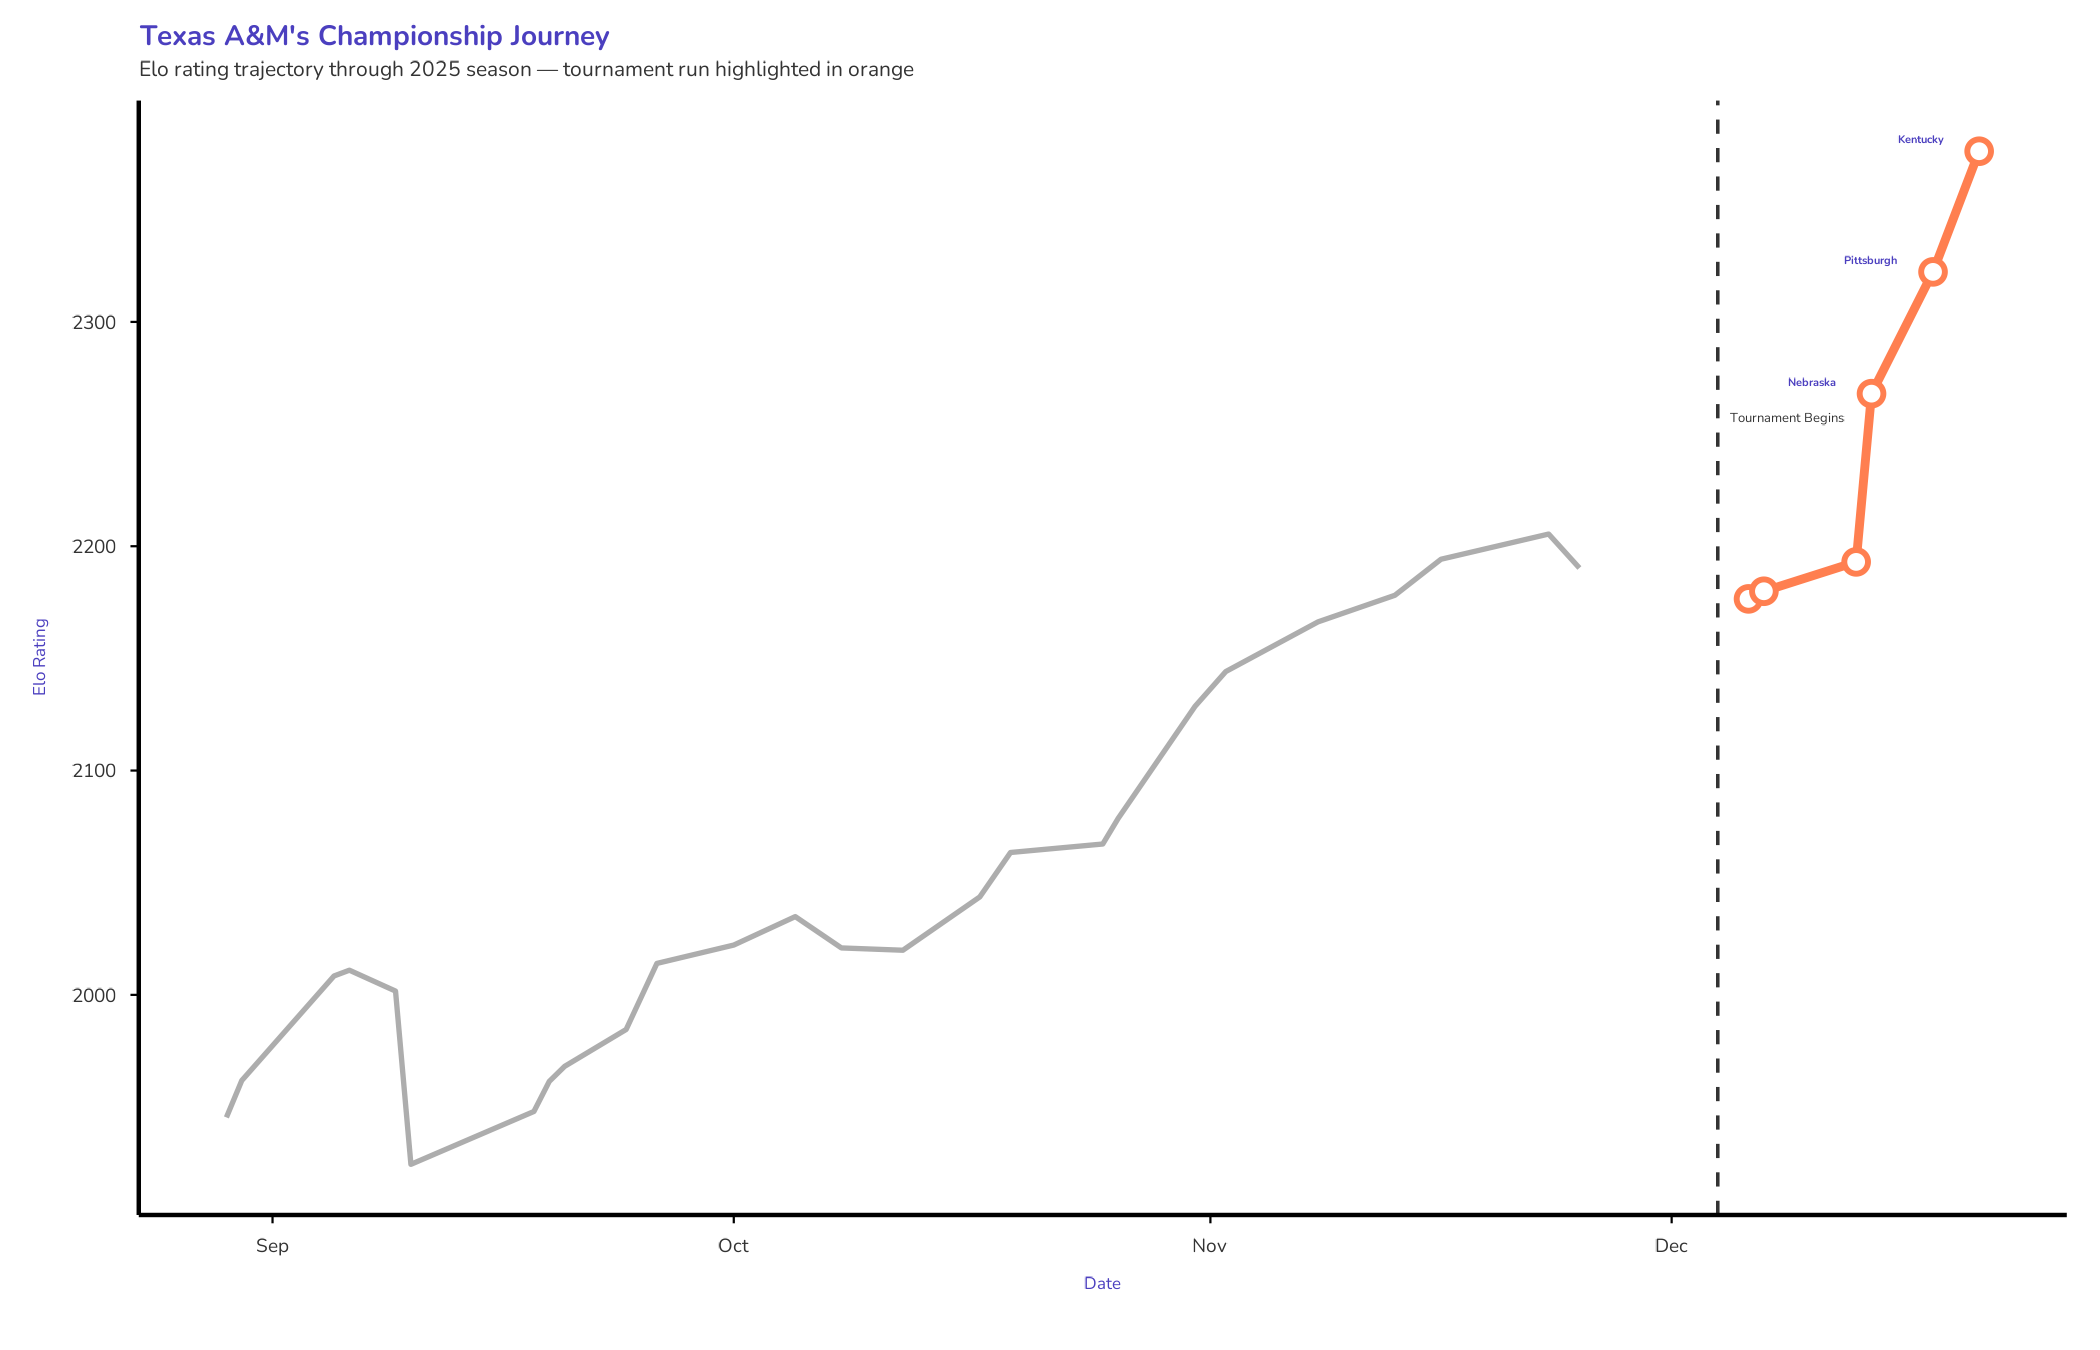
From late September through the end of the regular season, A&M climbed.
The trajectory was steady. Controlled. It was the kind of growth that comes from winning the matches you’re supposed to win and occasionally beating someone slightly better.
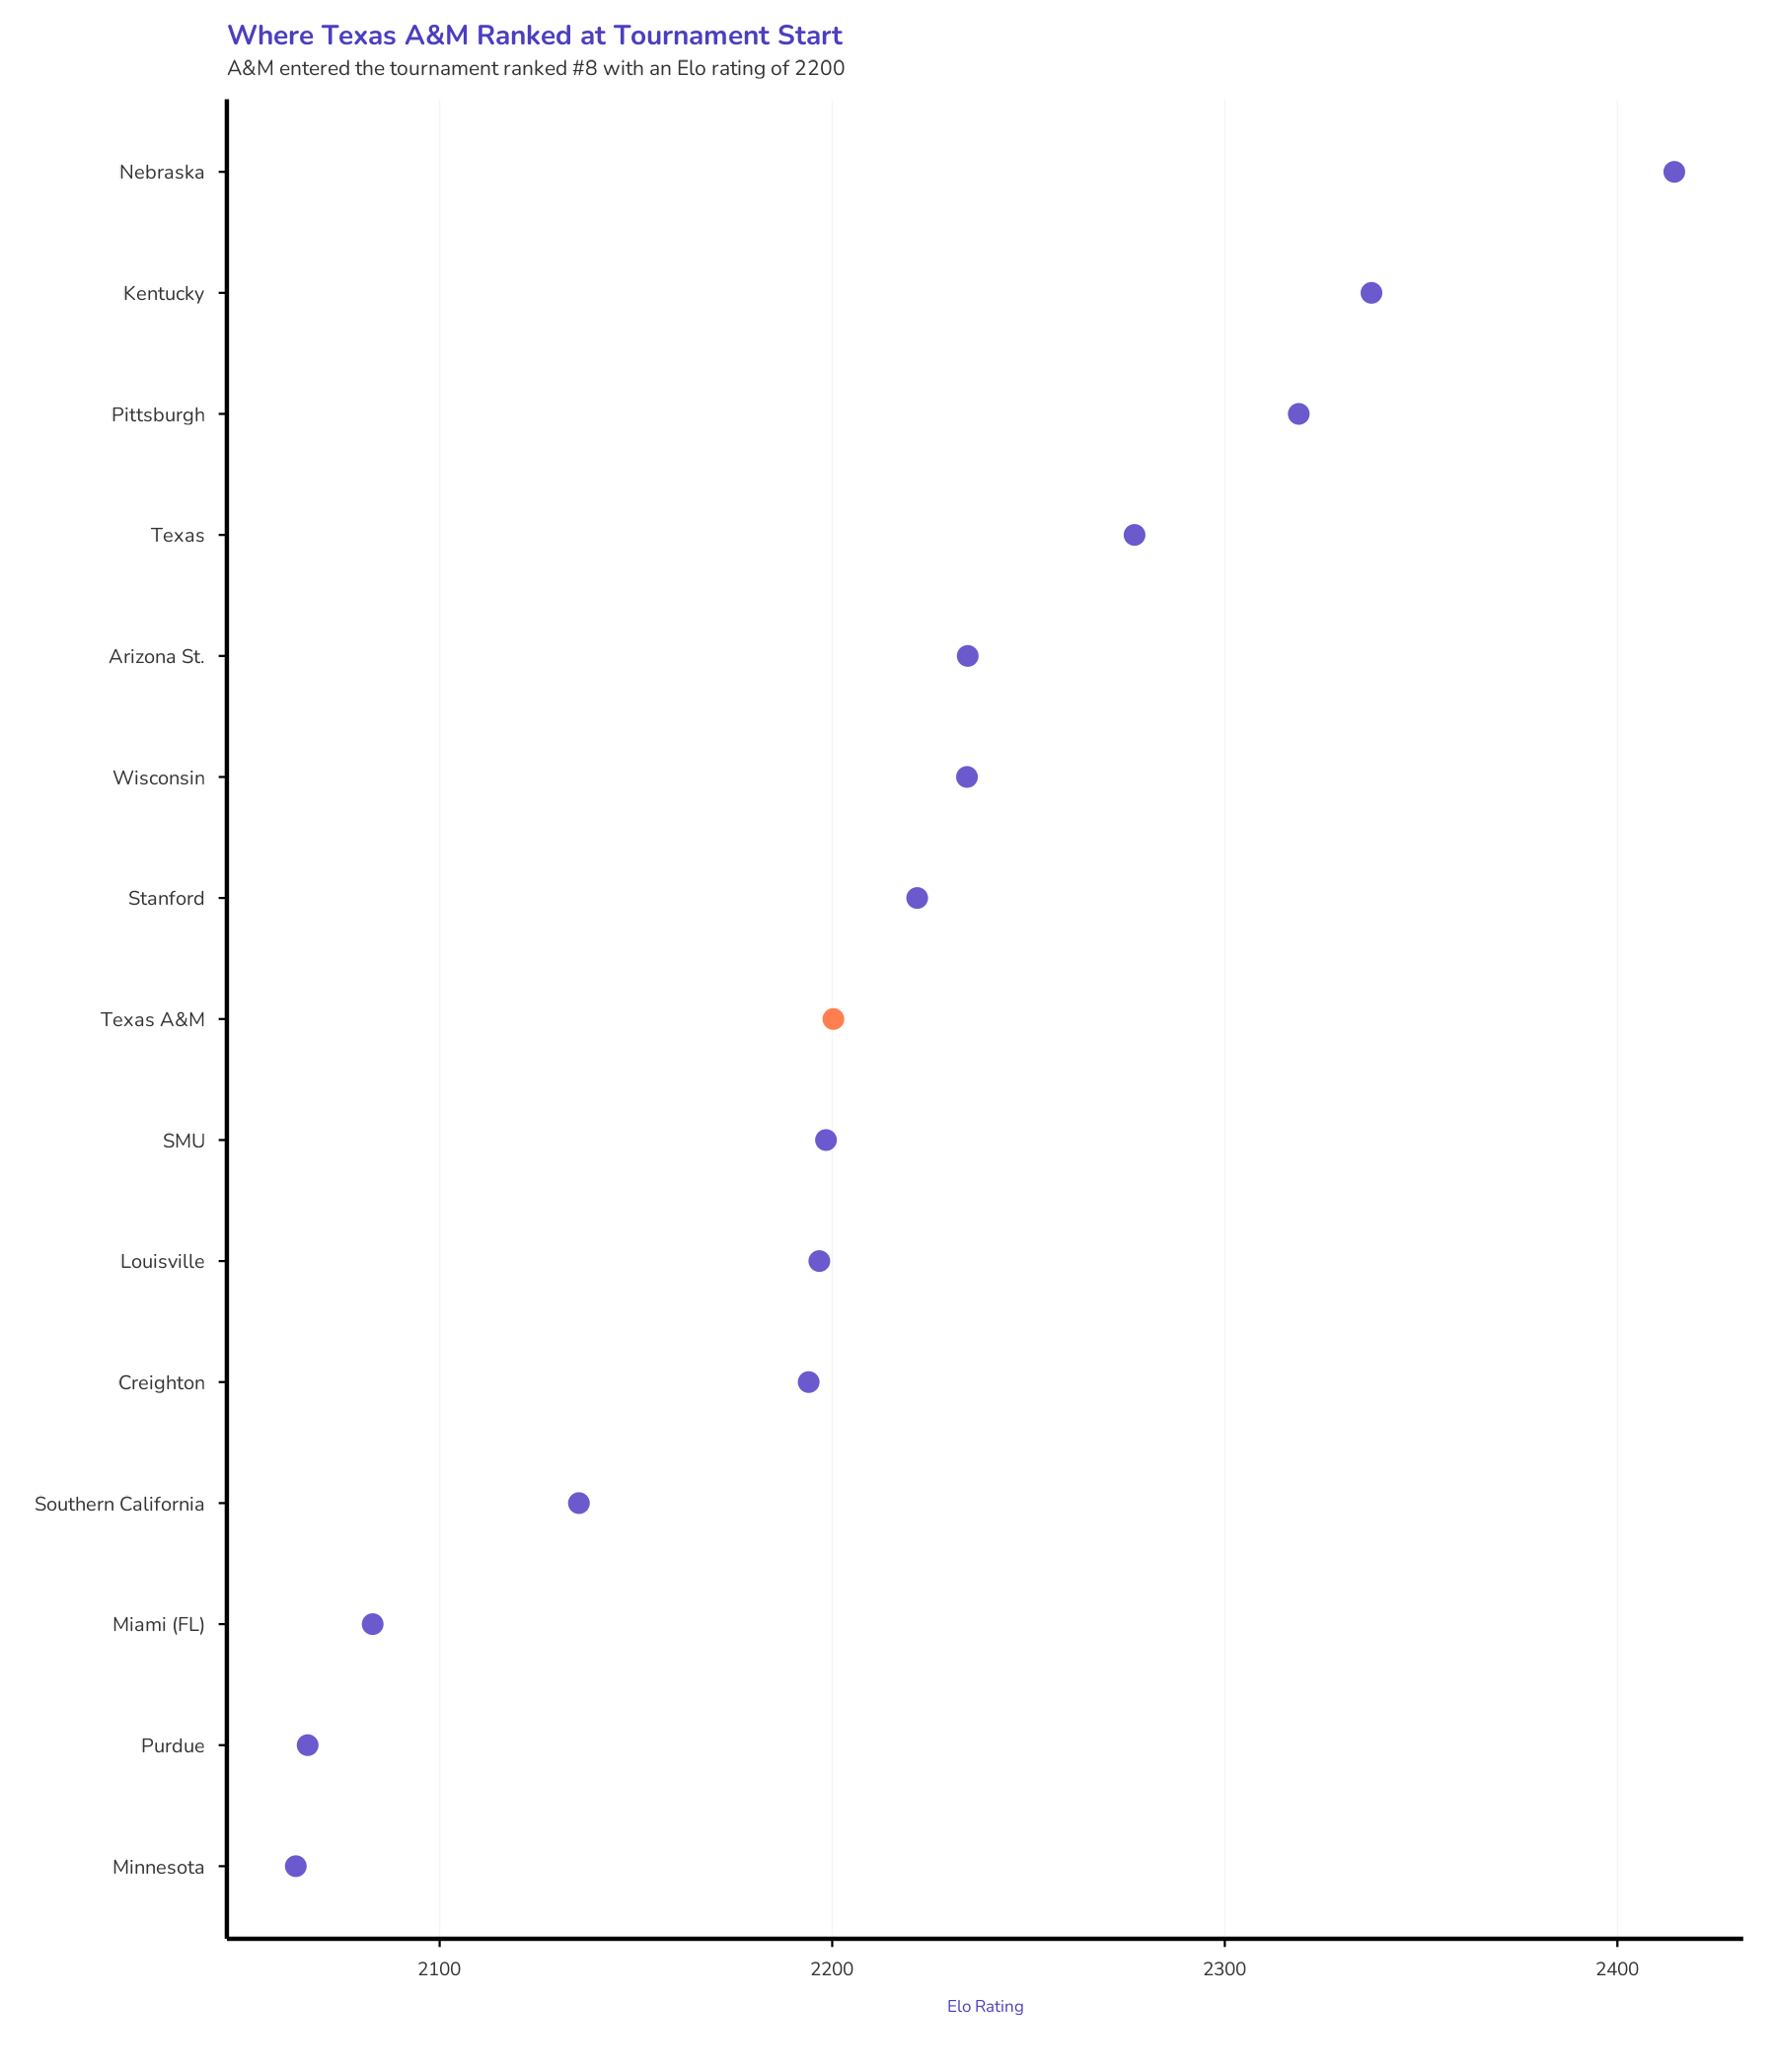
By tournament time, A&M’s Elo sat at 2167. That placed them 8th nationally—almost exactly where the selection committee had them as a 3-seed.
The model wasn’t hinting at hidden potential. It was saying: this is a very good team. Not elite. Not a favorite. Just solidly in the mix.
The Path
The first two rounds played to script.
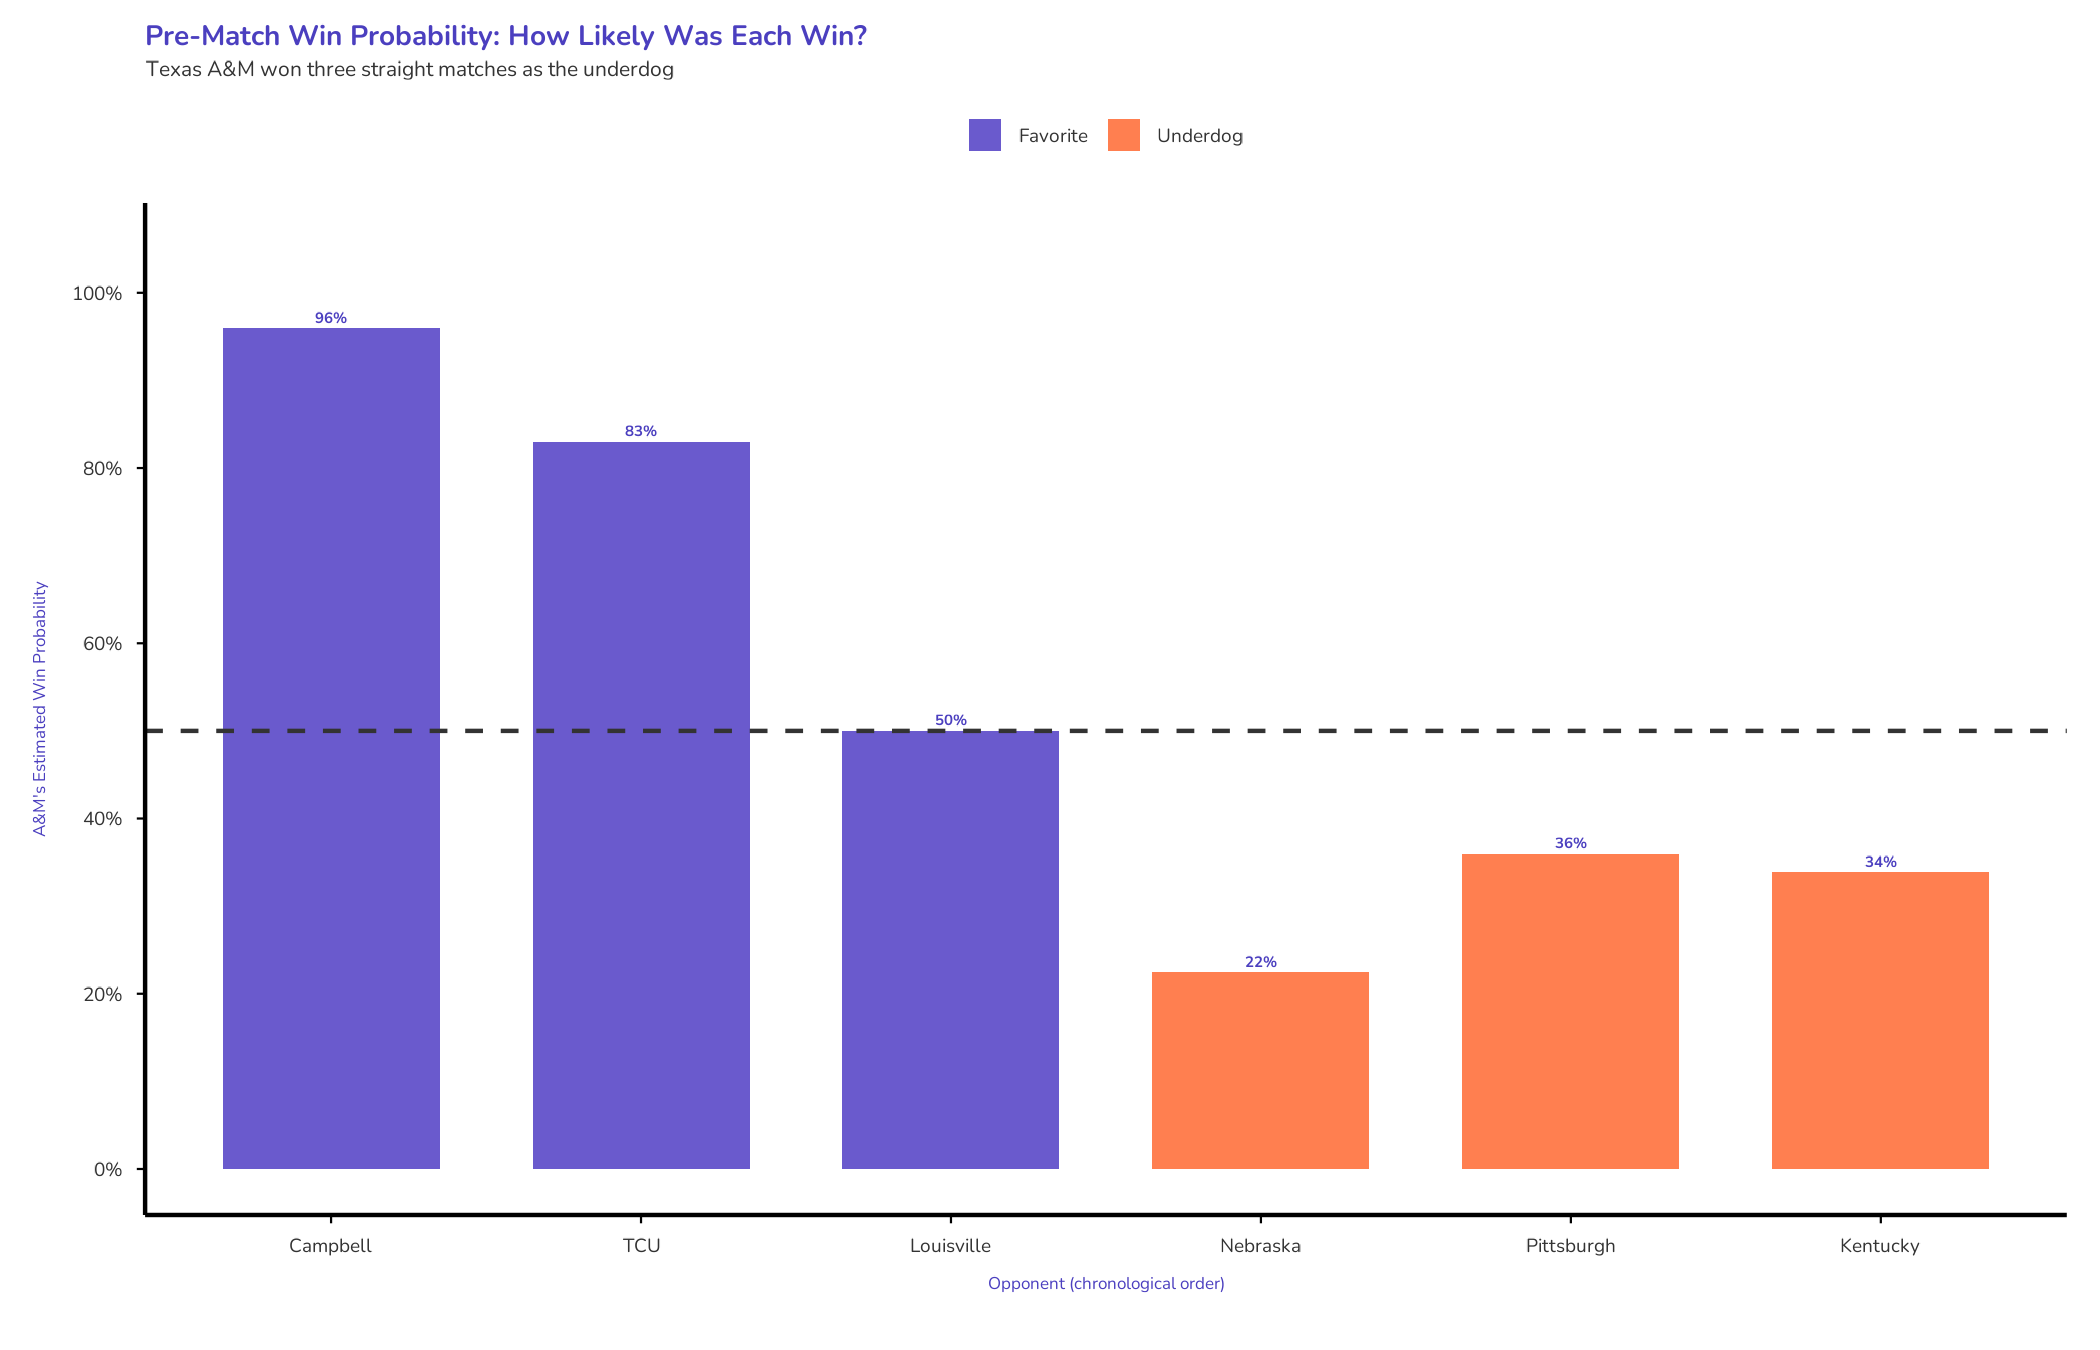
Campbell came in as a 14-seed with an Elo rating nearly 550 points lower than A&M’s. The model gave the Aggies a 96% chance to win.
They won. The rating moved three points to 2170.
When you beat a team you’re supposed to beat by that margin, the model barely registers it.
TCU, the 6-seed, presented slightly more resistance. A&M held a 276-point rating advantage—an 83% win probability. They handled it. Another modest bump: 13 points to 2183.
Through two rounds, A&M’s rating had inched from 2167 to 2183.
Steady. Unremarkable. Exactly what a 3-seed doing its job looks like.
Then Louisville.
The Sweet 16 matchup was a coin flip. Louisville’s Elo rating: 2183. A&M’s: 2183. Identical. The model called it 50-50.
A&M won.
Suddenly, the model started paying attention. The rating jumped 35 points to 2218—more than double the combined gain from Campbell and TCU.
This wasn’t a team beating weaker opponents. This was a team proving it belonged in a different conversation.
The Three That Changed Everything
What followed was a theorem in applied probability.
Nebraska. Pittsburgh. Kentucky.
Three straight 1-seeds. Three straight matches where A&M entered as the underdog. Three straight wins that forced the model to recalibrate what it thought it knew.
Nebraska was the inflection point.
The Huskers came in with a 215-point Elo advantage and a perfect record. A&M had a 22% chance according to the model.
When A&M won, the rating jumped 54 points to 2272.
The model updates based on surprise. When a heavy favorite wins, the system shrugs. When a significant underdog wins, the system recalibrates.
Four days later came Pittsburgh in the Final Four.
Pitt’s Elo rating sat at 2372—a 100-point edge over A&M’s 2272. The Aggies were underdogs again.
A&M won again. Another 54-point jump to 2326.
The pattern was becoming clear. This wasn’t luck threading through a bracket. This was a team beating elite opponents, and the model was adjusting its understanding accordingly.
Three days after that, the championship match brought Kentucky.
Kentucky entered with an Elo rating of 2442—the highest in the country at that moment. For the third straight match, A&M won as the underdog.
The final rating gain: 56 points to 2382. The largest single-match shift of the entire tournament run.
When it was over, A&M’s Elo rating sat at 2382. They’d climbed 182 points in three matches.
What the Model Saw
Here’s what the model didn’t do: predict the championship.
Going into the Elite Eight, Elo gave A&M a 22% chance against Nebraska. That’s not a bold call. It’s a statement of baseline probability.
The model didn’t see some hidden quality in A&M that everyone else missed. It didn’t anticipate the run.
It simply acknowledged that 22% isn’t zero—and when that outcome happens, the system responds.
A&M didn’t enter the tournament underrated. They were seeded appropriately. The model agreed.
But what Elo does—what it’s designed to do—is update when the evidence changes.
Each win against Nebraska, Pittsburgh, and Kentucky wasn’t just another result. It was new information. Evidence that A&M was better than the prior rating suggested.
By the time they lifted the trophy, A&M’s rating had climbed to 2382. Not because they were secretly elite in September, but because they became elite by December.
The model tracked that transformation in real time.
Why This Matters
Elo isn’t clairvoyant.
It gave A&M a 22% chance against Nebraska. A 36% chance against Pittsburgh. A 34% chance against Kentucky.
Those aren’t predictions of success. They’re assessments of probability.
The value isn’t in getting the prediction right. The value is in responding appropriately when the prediction is wrong.
Most ranking systems struggle with this. Polls anchor on prior beliefs. RPI treats margin of victory as irrelevant.
Elo updates. Every match. Every result.
That’s not magic. It’s discipline.
Elo gives us team strength—a moving, provisional estimate of relative ability. That’s the baseline.
But the real value of a baseline is what you can measure against it.
Once we have a disciplined way to track team strength, the questions multiply. Which conferences are actually stronger than their reputations suggest? Which programs have sustained excellence across multiple seasons? Where do historical peaks sit relative to today’s elite teams?
The Texas A&M run shows us that Elo can track a miracle in real time. Next, we’ll zoom out and see what it reveals about the bigger picture: the dynasties, the conference wars, and the historical peaks that define the modern era.
If team strength is our currency, it’s time to see who’s actually rich.