
Rethinking Standards: Turning Scouting into Leverage
How to turn a scouting report into a win probability problem

You’ve watched the film. You’ve broken down their rotations. You know their tendencies, their primary attackers, where they like to set in transition.
And still, the question sits there: what do we actually attack?
Every scouting report lands in the same place—more information than you can use in a single match. Six rotations. Multiple attackers. Serving patterns. Defensive alignments.
A buffet of information, and only one plate.
All of it matters. None of it matters equally.
The challenge isn’t identifying what your opponent does well or poorly. It’s knowing which of those things you can realistically exploit—and which ones carry enough leverage to be worth the effort.
That’s the gap this model was built to address.
Not by replacing film study or eliminating judgment calls, but by translating performance into a common language: win probability. Once you know what moves the needle, the scouting conversation shifts from “what are they bad at?” to “what can we actually punish?”
What the Model Sees
The framework we built in the previous pieces wasn’t designed for your team alone. It works the same way when pointed at an opponent.
Feed it their performance profile—how well they pass, how often they dig in system, their attack volume, their ability to generate freeballs—and it returns an estimate of their expected win probability against a league-average opponent.
That number alone doesn’t tell you much. What matters is the breakdown: which skills are propping them up, which ones are costing them, and—most critically—how those strengths and weaknesses translate into decision leverage.
Because some teams lose because they can’t pass. Others lose because their defense collapses. The box score might show both struggling, but the cost of each struggle is different. The model makes that cost visible.
And once it’s visible, you can decide whether you’re equipped to capitalize on it.
The Baseline (or: The Shape of the Team)
Before you talk about targets, you need to know what kind of team you’re facing.
Not in the vibes sense. In the structural sense.
This table is the scouting report before the scouting report—the shape of the opponent across the skills the model says matter most to winning. It’s not telling you what to do yet. It’s telling you what’s true.
That matters because scouting has a bad habit of skipping steps. We watch film, we find weaknesses, and we immediately jump to “how do we attack this?”
But “weakness” isn’t the same as “leverage.”
A team can be below average in a category and still be hard to beat because they’ve built margin somewhere else. Or because their weaknesses don’t interact with your strengths in a way that changes the match. Or because they’re volatile enough that the version you prepared for isn’t the version you get.
The baseline is where the model starts narrowing the buffet. It doesn’t remove your film work—it gives it context.
The Matchup Table
The heatmap gets the attention. This table does the work.
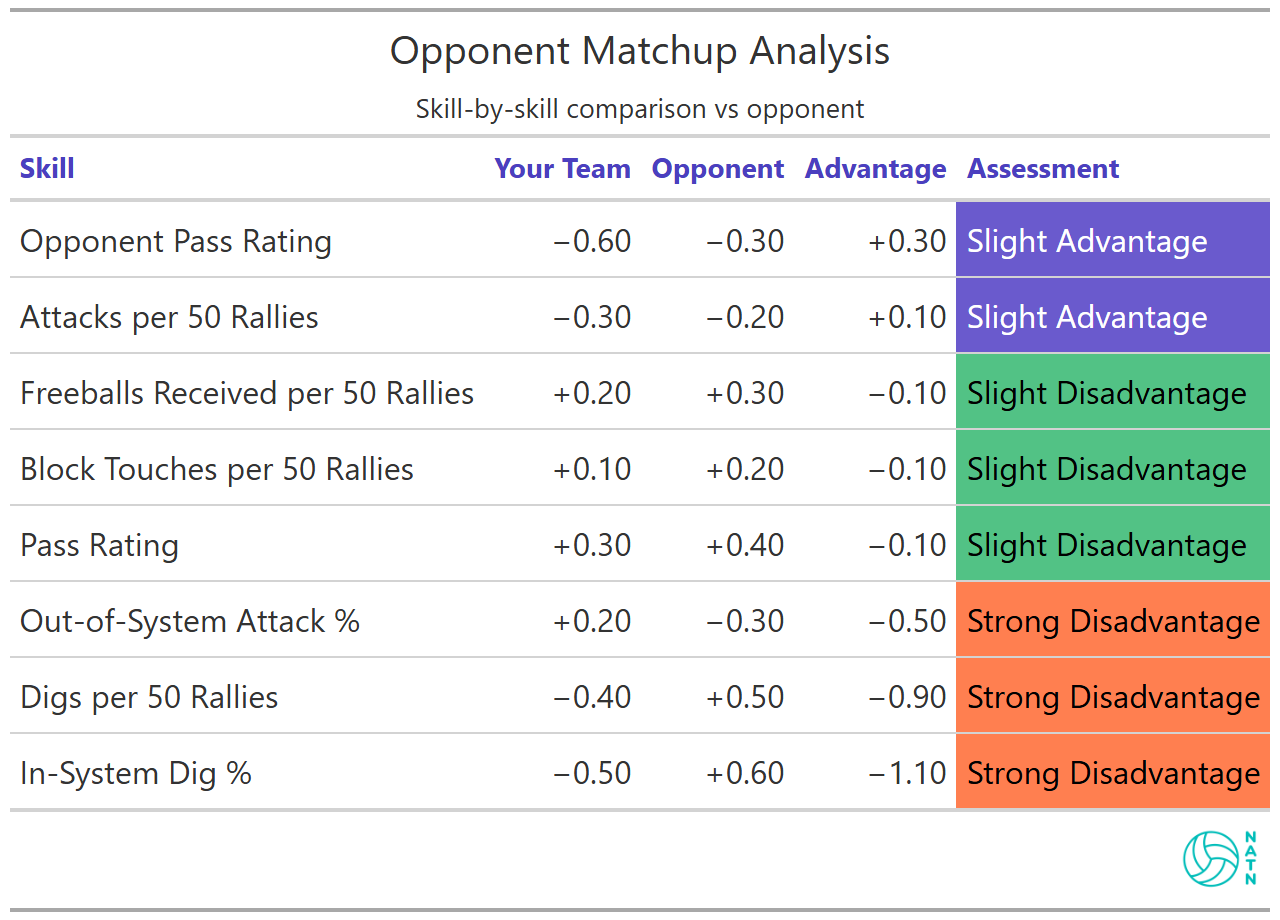
This is a straight skill-by-skill comparison—same category versus same category. No clever pairing. No “serving vs passing” mashups. Just: here’s you, here’s them, here’s the gap.
And it immediately forces specificity.
You’re not saying “we’re a good serving team.” You’re saying: relative to league average, our Opponent Pass Rating profile is -0.60 SD and theirs is -0.30 SD, giving us a +0.30 SD advantage.
That’s not a guarantee. But it’s a real edge. It means you’re slightly better than they are at making first contact uncomfortable.
You also have a small edge in Attacks per 50 Rallies (+0.10 SD). That’s not a headline advantage, but it suggests you generate swings a little more reliably than they do—more chances to score, more chances to apply stress.
Then the match flips.
Out-of-System Attack % shows a -0.50 SD disadvantage. That matters because it’s where a lot of “smart scouting plans” quietly go to die. You can win the serve-receive battle and still lose the match if you can’t cash the broken rallies you create.
And it gets sharper in the rally survival categories.
They hold a major edge in Digs per 50 Rallies (-0.90 SD) and an even bigger one in In-System Dig % (-1.10 SD). That’s compounding pressure: they’re not just digging more balls—they’re digging them in a way that turns into offense.
This is the kind of opponent that doesn’t just “play good defense.” They turn defense into tempo. They make your best swing feel like a setup.
So the matchup table doesn’t just tell you where you’re better. It tells you what kind of win is available.
If your edge is first contact but your disadvantages are transition conversion and dig-to-system offense, then the match isn’t about winning points cleanly. It’s about preventing the match from becoming a grind you’re structurally built to lose.
Not Every Weakness Is Worth Your Time
This is where most scouting reports get seduced by their own detail.
You circle their OH1 because she’s hitting .120 in transition. You star their libero because she shanks jump floats. You write “get them OOS” in bold, underline it twice, and feel like you’ve done your job.
Then the match starts and it still feels…fine. You’re getting them out of system. You’re accomplishing the thing you planned to accomplish.
And yet the scoreboard doesn’t move the way it’s supposed to.
Not because you were wrong. Because you were incomplete.
You built your plan around a weakness without asking what sits downstream of it.
If your opponent has built resilience out of system—stronger pins, cleaner emergency tempo, better decisions under stress—then “getting them OOS” isn’t a win condition. It’s just a state of play.
You’re not wrong to pressure them. You’re just spending energy on something that may not move win probability as much as you expect.
That’s not a mid-match adjustment problem. That’s a pre-match prioritization problem.
And it’s exactly where the model helps.
Consistency: How Much the Floor Moves
Averages are useful. They’re also a trap.
Because most matches don’t get decided at the average. They get decided when one team plays a little above their baseline—or when one skill slips just enough for everything downstream to wobble.
That’s what this section is about.
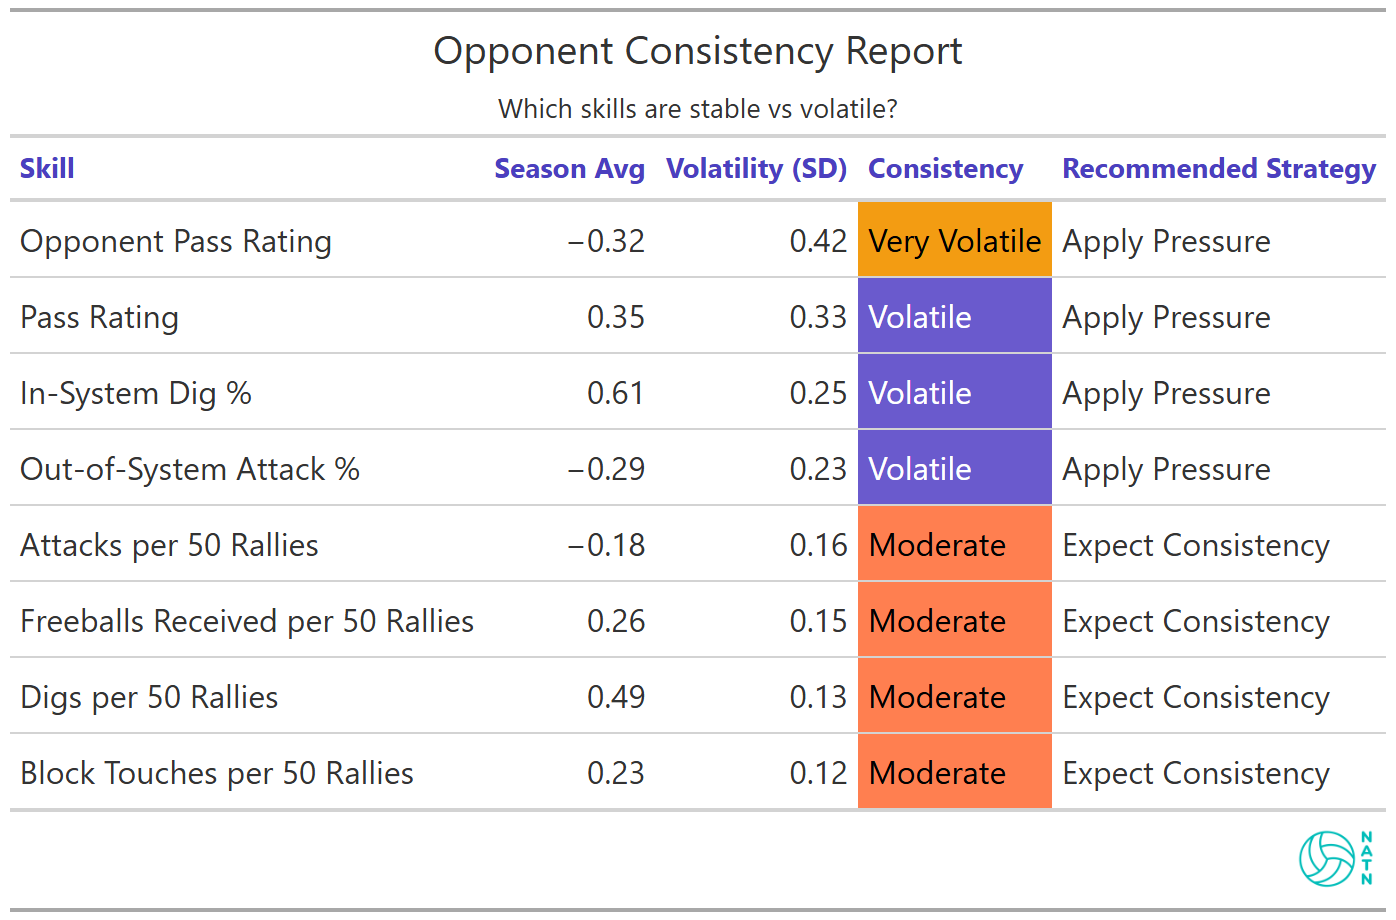
This report tracks volatility—how much each skill swings around the season average. It’s not “who’s good.” It’s “who’s stable.”
And it’s one of the most useful pre-match questions you can ask, because volatility is where pressure actually pays off.
Their Opponent Pass Rating is the loudest signal on the board: season average -0.32 SD, volatility 0.42 SD, labeled Very Volatile.
That’s not just weakness. That’s instability.
It means you’re not trying to beat their average—you’re trying to widen the distribution. You want to drag them into the part of their range where the wheels come off.
Your own Pass Rating shows volatility too (0.33 SD, labeled Volatile). That matters for a different reason: it means this match may swing on first contact, not because one team is definitively better, but because the floor is moving under both of you.
A few other categories sit in the “pressure-sensitive” zone as well—In-System Dig % (0.25 SD) and Out-of-System Attack % (0.23 SD) both register as Volatile. Useful. Those aren’t fixed traits. They wobble.
Then there are the stabilizers: digs per 50 (0.13 SD), block touches (0.12 SD), freeballs received (0.15 SD). Moderate volatility. Expect consistency.
In other words: you shouldn’t build a plan around hoping they simply stop defending. But you can build a plan around stressing the parts of their game that wobble—because the data says those parts wobble often.
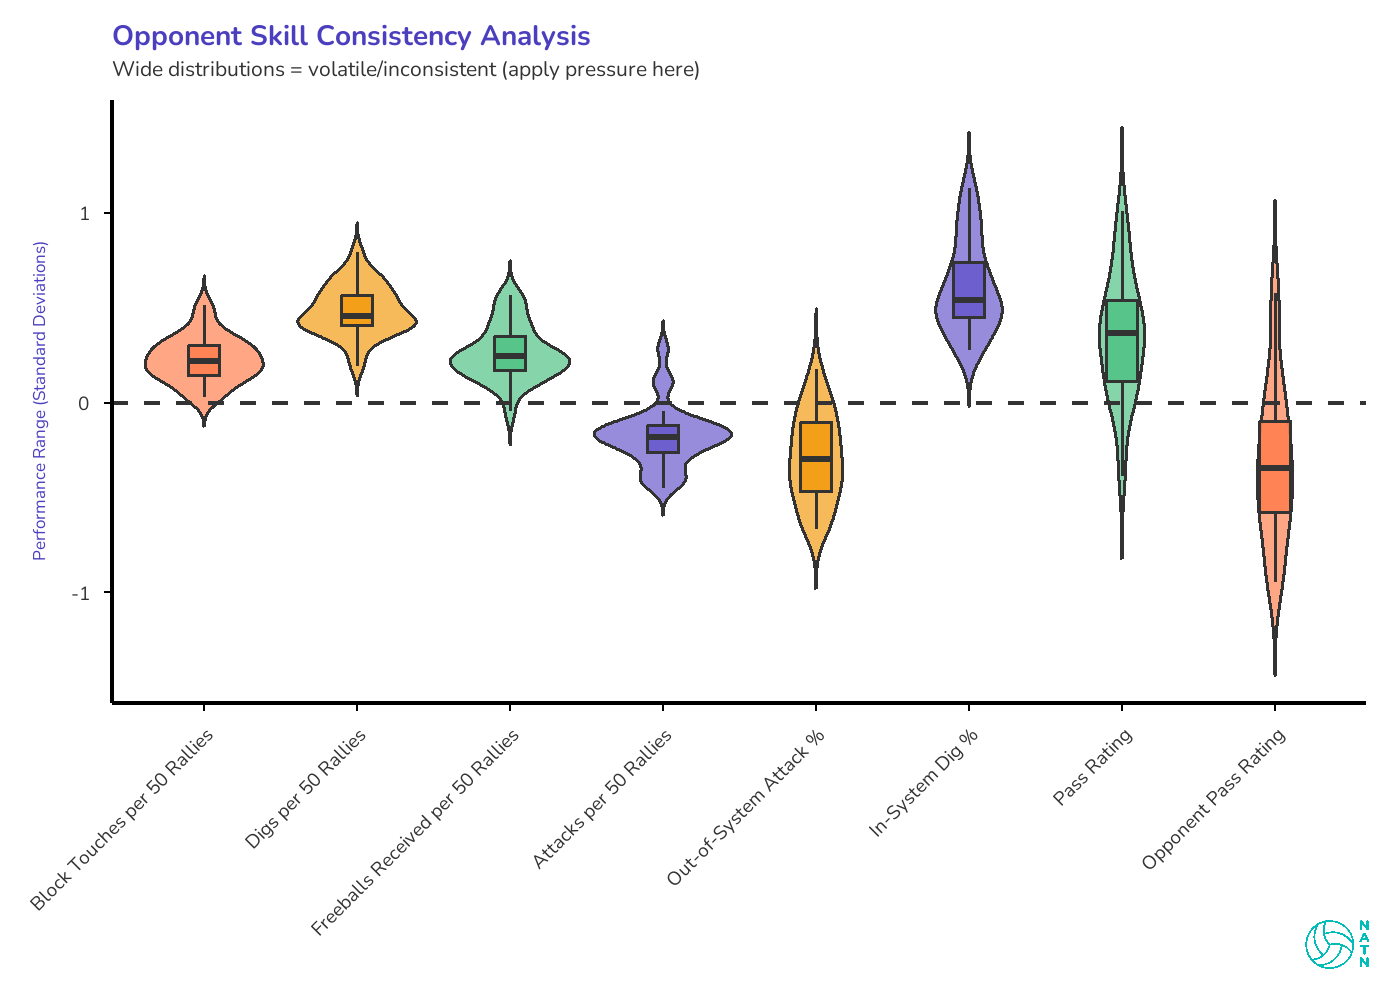
The violin plots show this visually. Wide shapes mean high variance—lots of different versions of that skill across the season. Narrow shapes mean predictability.
If you’re trying to decide whether “apply pressure” is strategy or just a motivational poster, this is the answer.
Where the Leverage Actually Lives
Baseline tells you what kind of team they are. The matchup table tells you where the edges are. Consistency tells you how much those edges might move.
Now we turn all of that into a short list.
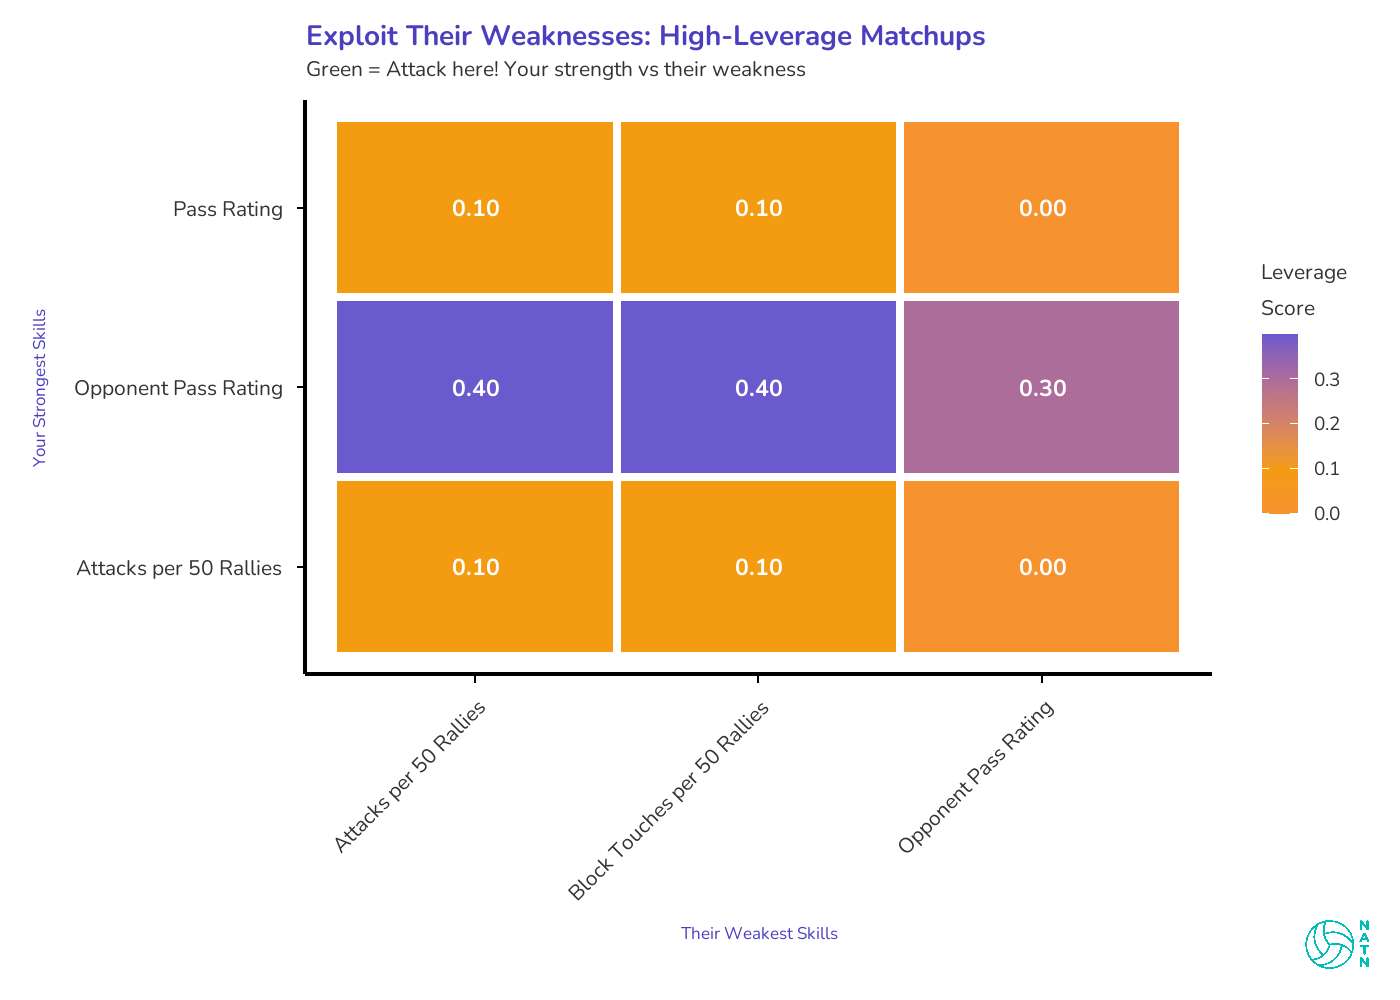
This heatmap is the model’s attempt to do what scouting meetings always say they’re going to do: turn a buffet of information into a few fights worth picking.
Green doesn’t mean “guaranteed points.” It means leverage—the gap between your profile and theirs, in a way that’s decision-relevant.
And in this matchup, the message is pretty blunt.
Most of the board is noise. A lot of 0.10s. A couple 0.00s. If you were hoping the model would validate six different “we should go after…” ideas from film, it mostly refuses.
But one row lights up: Opponent Pass Rating.
Your leverage score hits 0.40 against two of their weakest areas—Attacks per 50 Rallies and Block Touches per 50 Rallies—and still sits at 0.30 even when you compare it directly to their own weakness in Opponent Pass Rating.
That’s the model telling you: this match is going to be decided by whether you can make first contact miserable enough to matter.
Not “serve tough” as a motivational phrase. Serve pressure as an actual structural advantage.
And it also tells you something quieter: don’t waste the week preparing for the wrong fight. If most of the other leverage scores are marginal, then chasing those edges is how you end up with a plan that sounds smart in the scout… and doesn’t show up on the scoreboard.
What This Isn’t
This framework won’t replace your assistant coaches. It won’t tell you which rotation to target first, which server to put on the line in the fifth set, or how to adjust when your opponent switches their libero mid-match.
It also won’t account for things it can’t see: chemistry, injuries, whether their best hitter is sick, or the fact that their freshman setter sometimes turns into Karch Karai when she plays at home.
What it does is translate observable performance into decision-relevant terms. Not “they’re bad at digging,” but “their in-system dig conversion edge is big enough that we need to plan for long rallies to be expensive.”
It doesn’t remove coaching. It removes one of coaching’s most expensive mistakes: spending a week preparing for the wrong fight.
Using the Framework
In practice, this starts with pre-match prep. Identify the two or three highest-leverage matchups. Structure your serving strategy, defensive alignments, and transition offense around exploiting those edges.
Don’t try to fix everything. Don’t attack every weakness. Pick the fights the model says are worth having.
During the match, the framework becomes a pivot point. If a high-leverage edge isn’t materializing—maybe they’re passing above their baseline, or your pressure isn’t converting into the rallies you expected—the matchup table tells you where to redirect. What’s the next-best edge? What can you lean into without rewriting your whole system mid-set?
After the match, compare expected versus actual performance. Did the edges the model identified show up? If not, why? Execution, adjustments, variance, or something the model can’t see? That feedback loop tightens your ability to distinguish signal from noise.
The value compounds over time. One match, the framework clarifies priorities. Over a season, it sharpens your ability to see which edges are durable and which ones disappear under pressure.
The Broader Picture
Scouting has always been about leverage. Which tendencies can we exploit? Which matchups favor us? Where should we apply pressure?
The answers usually come from experience, intuition, and selective memory. That isn’t wrong. It’s just incomplete.
This framework doesn’t replace that process. It disciplines it. It makes costs and tradeoffs visible before you commit resources. It separates the weaknesses that are expensive from the ones that just look bad on paper.
Not every weakness is worth your time. But the ones that are? The model makes it harder to ignore them—and harder to waste energy on the ones that aren’t.