
Rethinking Standards: What the Model Reveals
How Process Metrics Shape Winning in Division I Volleyball

Standards should predict, not just describe.
That was the premise of the last piece. Averages tell us what happened. Standards are supposed to tell us what actually buys teams leverage. Those are not the same question.
This is what happens when you take that distinction seriously.
We built a model to explore it.
What We’re Working With
Before getting into results, it’s worth being clear about what this model is—and what it isn’t.
Conceptually, the model is simple. It takes performance metrics—passing, attacking, defense, ball control—and estimates how they relate to winning sets.
You feed it what actually happened in a set: how well both teams passed, how often they dug balls into system, how many attacks they took, how many freeballs they generated. Across thousands of sets, the model learns which patterns consistently show up in wins versus losses. From there, it assigns a win probability to any given performance profile.
The inputs are all process metrics—things you can measure, train, and influence. Joe Trinsey has a line I like: as a statistic becomes more predictive, it becomes broad to the point of uselessness. A model that says “get more kills” might be accurate, but it doesn’t tell you how. We already know kills matter. The real question is how teams create kill opportunities in the first place. That’s what this framework is built to explore.
We’re not predicting the future. We’re describing the past in probabilistic terms. The model was trained on every Division I match from 2017 to 2024. That gives us a wide lens: a large sample, stable estimates, and a clear picture of what has driven winning across the sport.
That breadth comes with tradeoffs.
Nebraska probably doesn’t want standards built on data from teams they’ll never play. A mid-major program may not care what the model says about top-25 matchups. Different resources, different styles, different versions of the game in meaningful ways.
The approach works the same way regardless. You can apply it to whatever slice of data fits your context—power conferences only, a single season, or just your own matches.
This is one way to do it. Yours might look different. That’s not a flaw—it’s the point.
Does It Work?
A model is only useful if you can trust what it tells you.
That trust comes from several places: how well it separates wins from losses, how stable its estimates are across seasons, whether it behaves sensibly in edge cases, and whether its outputs align with the structure of the game. Across those checks, the model performs well.
Across those checks, it holds up. But the clearest one to show is calibration.
When the model assigns a probability to a set outcome, that number has to mean something. A team given a 70% chance to win should win roughly seven sets out of ten. A team with a 25% chance should win about one in four. If those relationships don’t hold, the output isn’t insight—it’s decoration.
This isn’t about math—it’s about whether the numbers tell the truth.
The calibration curve makes that visible.

The curve tracks closely to the diagonal. If it didn’t, nothing else in this piece would be worth discussing.
And once the probabilities proved honest, the model stopped being merely descriptive and started being uncomfortable. Because now the question wasn’t whether it worked—but what it was willing to contradict.
Averages can always be explained away. Probabilities can’t. When a calibrated model assigns real cost to a pattern—when it tells you that something you value doesn’t buy as much leverage as you think—it forces a reckoning. Either the model is wrong, or your assumptions are.
That’s why calibration matters here. Not because it stands apart from the other diagnostics, but because it makes trust visible—and once trust is visible, contradiction becomes unavoidable.
Attacking Matters. But So Does Everything Before It.
Going into this, I expected attack quality to dominate the model. That’s how the sport feels when you watch it. Kills end rallies. Missed swings lose them.
Attacking still matters. But it isn’t where the biggest leverage shows up.
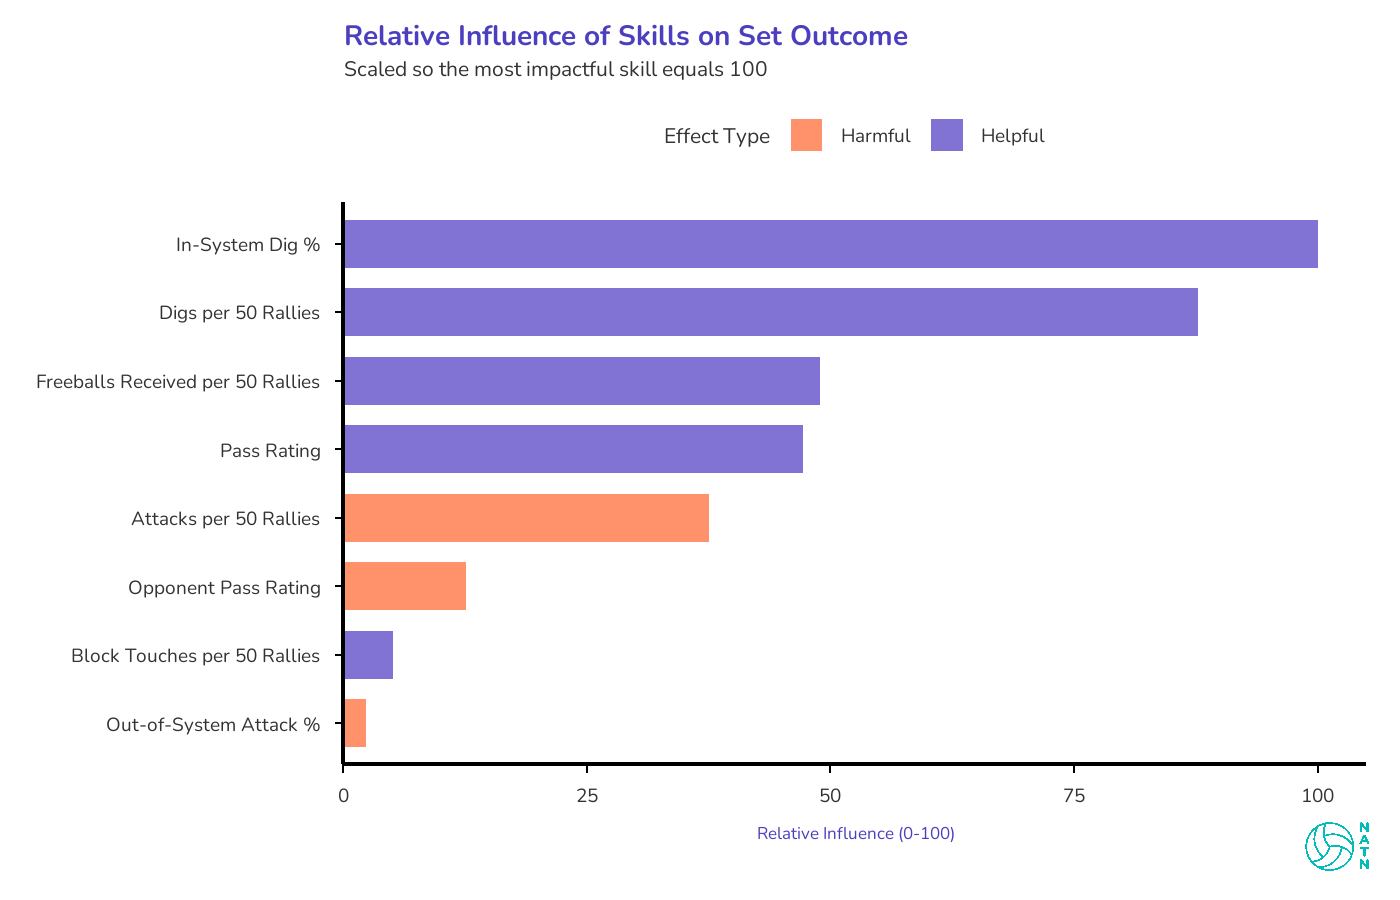
The strongest drivers of winning aren’t really about how well teams attack. They’re about how often teams get to attack cleanly. That distinction quietly reshapes which skills actually buy teams leverage.
Three of the four most influential features are doing the same job: deciding whether the offense gets to operate in system instead of merely survive. In-system digs. Freeballs received. Pass rating.
Anyone who’s watched a match at this level knows the difference. An in-system ball—off a perfect pass or a dig that lets the setter stay square—allows tempo, distribution, and pressure on the block. An out-of-system ball turns the rally into damage control.
The model isn’t choosing sides between offense and defense. It’s pointing out that they’re collaborating. Attacking is how points end. Access to an in-system offense is where leverage is created.
One result I expected to matter—and didn’t—was set distribution entropy.
The intuition is familiar: offenses that distribute sets more evenly across locations should be harder to predict, create more one-on-ones, and generate better attacking conditions overall.
It didn’t survive the final model.
That result fits cleanly with what shows up elsewhere in the analysis. Distribution isn’t leverage on its own—it’s an amplifier. Location variety only becomes dangerous once the offense has already earned access to an in-system look often enough for tempo and threat to exist.
Spread without pressure doesn’t buy you anything. The model isn’t dismissing offensive balance. It’s placing it downstream of the conditions that make balance matter in the first place.
Defense Is Where Teams Separate
Defense is where teams separate.
Not because defense scores points directly—it doesn’t—but because it shapes whether rallies end immediately or continue in a way that preserves offensive options.
The curves below show what actually happened in the data—how often teams won when they lived in certain ranges, regardless of performance elsewhere. The tables later show what the model estimates would happen if one thing changed while everything else stayed the same.
Both curves trend upward. Better in-system dig percentage, higher win probability. Better pass rating, higher win probability. But the slopes are different. The in-system dig curve is steeper, more linear, more relentless. Every improvement buys real gains, and those gains don’t plateau. The pass rating curve is gentler—it matters, but not as dramatically.
That gap tells you something about where leverage lives.
In-system digs show up as one of the strongest drivers of winning. That shouldn’t be surprising to anyone who’s coached or played at this level. A dig that allows the setter to stay square keeps tempo available, preserves distribution, and forces the block to honor multiple threats. A dig that doesn’t effectively ends the rally on the next contact.
This is where the model becomes quietly opinionated. It isn’t rewarding spectacular defensive plays. It’s rewarding the boring ones—the digs that don’t show up on highlight reels but consistently return rallies to neutral or better.
That’s the separation. Not effort versus effort, or toughness versus toughness, but how often a team turns defense into usable offense. Over a large enough sample, that difference compounds.
Attacking ends points. Defense decides how often teams get to attack under conditions that make ending points possible.
The Attack Volume Thing
Attack volume shows up in the model in a way that’s easy to misread.
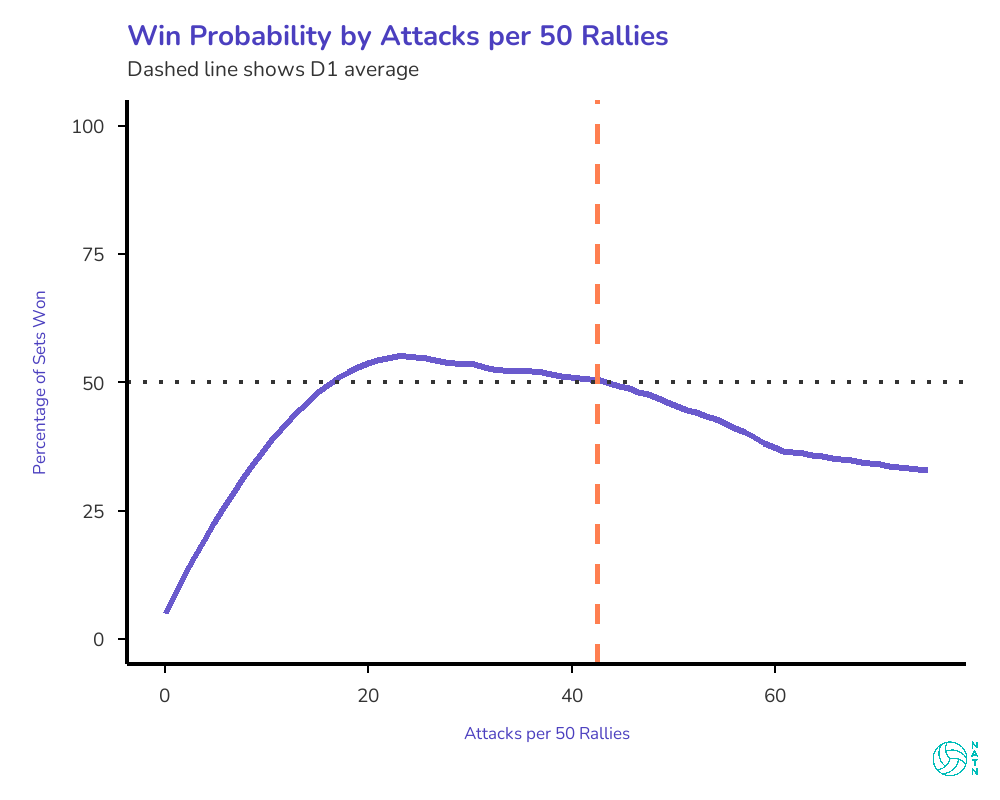
On its own, higher attack volume is negatively associated with winning. That feels counterintuitive. Teams that swing more often seem aggressive, in control, proactive.
But volume itself isn’t the problem. Why you’re generating volume is. If you’re swinging a lot because you can’t finish—because you’re out of system and the ball keeps coming back—that’s costly. If you’re swinging a lot because you’re controlling rallies and forcing your opponent to scramble, that’s valuable, but the model captures that elsewhere. Freeballs received. Opponent out-of-system percentage. The good kind of volume shows up in those metrics, not in raw swing count.
What attack volume mostly captures is what happens when rallies continue without being resolved.
The problem is that volume isn’t resolution.
Attack volume mostly captures what happens when rallies continue without being finished. More swings often mean more chances, but they also mean more opportunities for something to break down—another dig to convert, another transition to manage, another out-of-system ball to survive.
This isn’t an argument against attacking. It’s an argument against treating more swings as the same thing as finishing points.
The model doesn’t penalize teams for being aggressive. It just refuses to reward volume that isn’t paired with the conditions that make attacks decisive. Without consistent access to in-system looks, additional swings don’t create leverage—they expose teams to more risk.
That pattern—volume mattering less than the conditions that generate it—shows up across the model. Which brings us to how to actually read these numbers.
What These Numbers Are—and Aren’t
It’s worth being clear about what these numbers are—and what they aren’t.
They aren’t rankings of skills. They aren’t prescriptions for how teams should play. And they aren’t a substitute for coaching judgment or context.
What they are is a way of imposing discipline on how we talk about performance. Instead of asking whether a skill is good in the abstract, the model asks what it tends to buy teams in terms of win probability, given everything else happening in the set.
That framing matters. Volleyball decisions are always made under constraint—roster composition, opponent quality, matchups, risk tolerance. The model doesn’t remove those constraints. It just makes the tradeoffs harder to ignore.
Here’s what that looks like in practice. Say you’re below average in in-system dig percentage. The tables tell you roughly what that’s costing in terms of win probability. Now you can ask better questions. What would it take to move to average? Is that realistic given who’s on the roster? If we can’t improve there, where else can we make gains that offset it? What would we have to sacrifice—practice time, personnel decisions, strategic emphasis—to get there?
The tables don’t answer those questions. They just make it harder to pretend they don’t exist.
Different teams will read the same results differently, and they should. A team with elite attackers may lean into one set of costs. A team without them may need to find leverage somewhere else. The framework doesn’t flatten those differences. It clarifies them.
This is not an answer key. It’s a way of asking better questions, with fewer places to hide.
Attacks per 50 Rallies
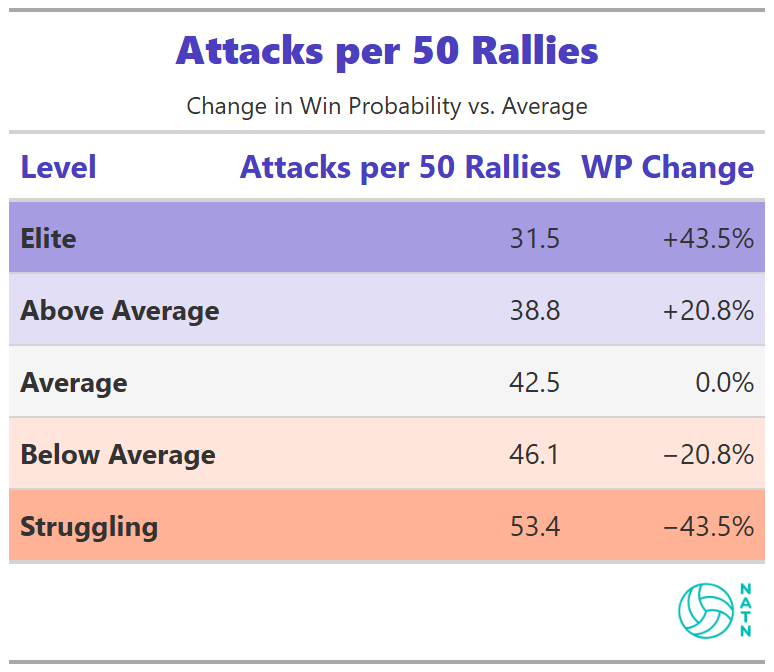
Elite teams, on average, take fewer attacks per 50 rallies than struggling ones. The gap in win probability between those extremes is significant.
This doesn’t mean attacking less is inherently good. It reflects the cost associated with extended rallies that don’t resolve—swings that come back, out-of-system balls that extend play without creating pressure.
Volume driven by control looks very different than volume driven by necessity. If you’re generating swings because you’re forcing opponents to scramble, getting freeballs, dictating the rally—that’s valuable, but it shows up elsewhere in the model. What raw attack volume mostly captures is what happens when teams can’t finish.
The table doesn’t reward patience. It penalizes survival.
Pass Rating
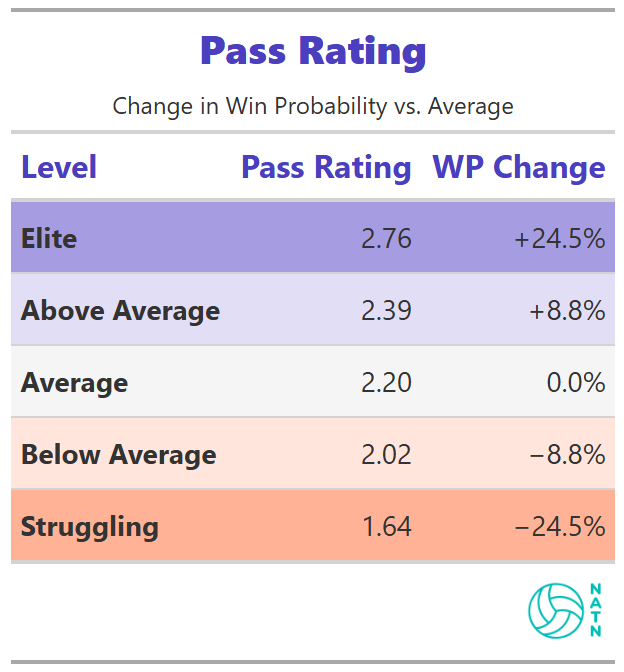
Pass rating improves estimated win probability in a steady, controlled way. Better passing steadily increases win probability. Poor passing carries a real cost. But the slope is controlled, not explosive.
That matters. It reinforces what shows up elsewhere in the model: first contact is essential, but it’s not the whole story. Passing buys access to in-system offense. What you do with that access—how often you stay in system after the first swing, how effectively you convert those opportunities—determines how much value you actually extract from it.
Good passing opens the door. It doesn’t guarantee you walk through it.
Block Touches per 50 Rallies
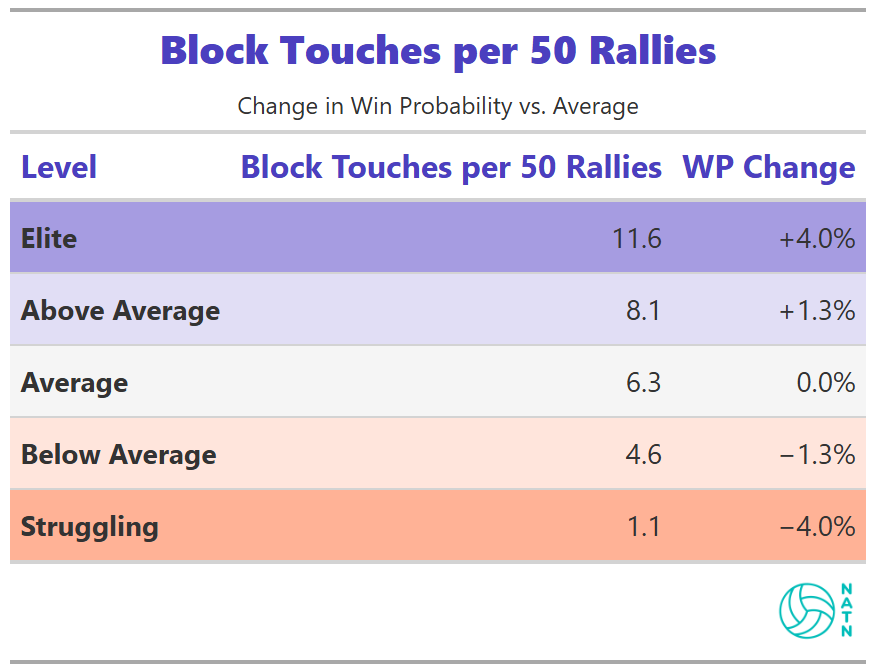
More block touches are associated with slightly higher win probability. The effect is modest compared to other process metrics.
That doesn’t mean blocking doesn’t matter. It means blocking alone doesn’t move win probability far unless it feeds something else—transition opportunities, recycled system offense, pressure that compounds over the rally.
The model isn’t impressed by isolated events. It rewards sequences.
Digs per 50 Rallies
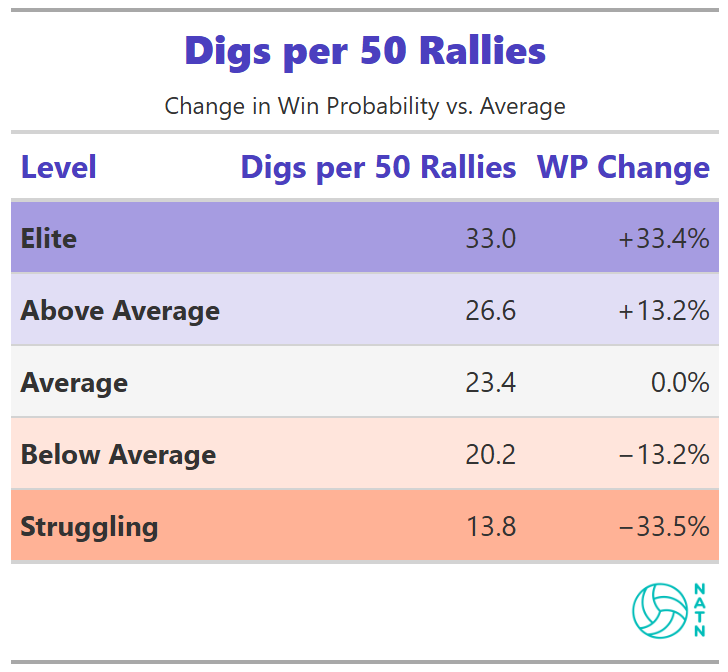
Higher dig volume is associated with higher estimated win probability. The relationship is strong—stronger than blocking, more visible than most other process metrics.
The table reflects frequency, not quality. But frequency matters because it signals something deeper. Teams that generate more digs are forcing opponents to swing more often, which means they’re controlling rallies, extending points where they have the advantage, and creating more chances to transition into offense.
Low dig volume often means the opposite: getting aced, getting blocked, or watching opponents terminate on first contact. The table doesn’t explain why volume matters. It just shows that it does.
In-System Dig %
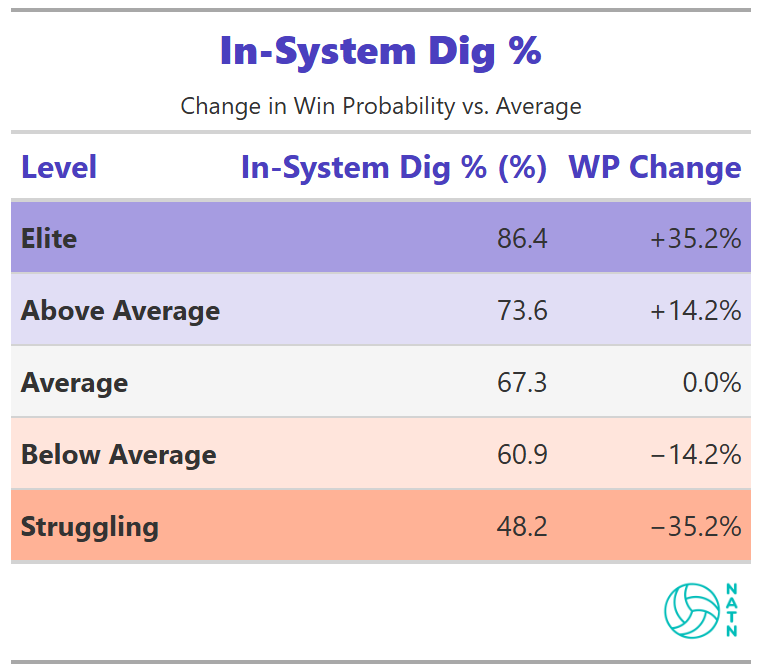
In-system dig percentage is the strongest single driver in the entire model.
The difference between low and high tiers exceeds 70 percentage points in estimated win probability. No other metric approaches that magnitude.
The relationship is linear. Improvements continue to pay off across the full range.
Freeballs Received per 50 Rallies
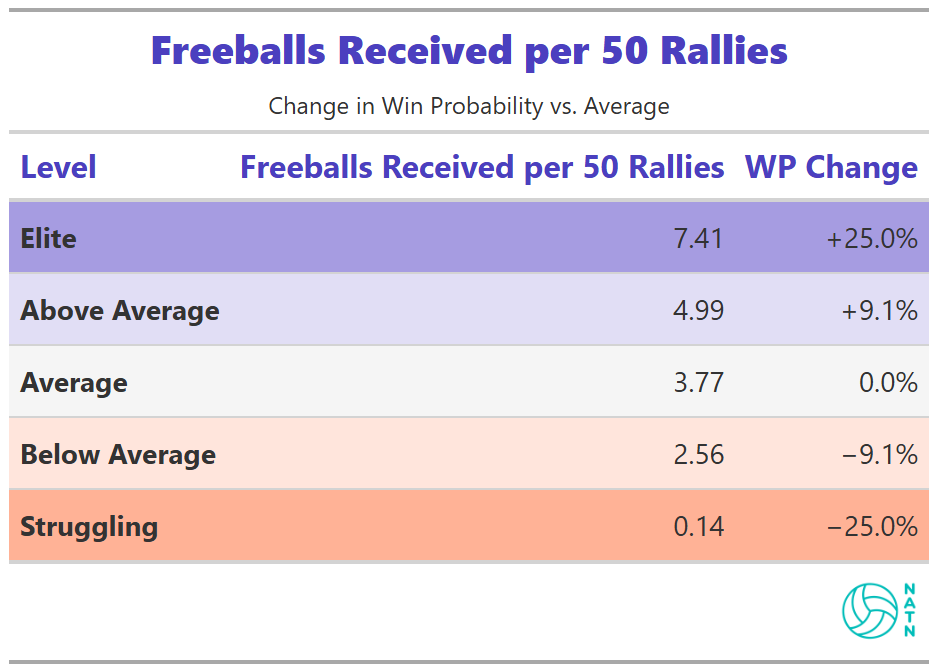
Freeballs received shows one of the largest tier gaps in the model.
Teams that receive more freeballs tend to have much higher estimated win probabilities. The relationship is strong and persistent.
The table captures presence, not mechanism.
Out-of-System Attack %
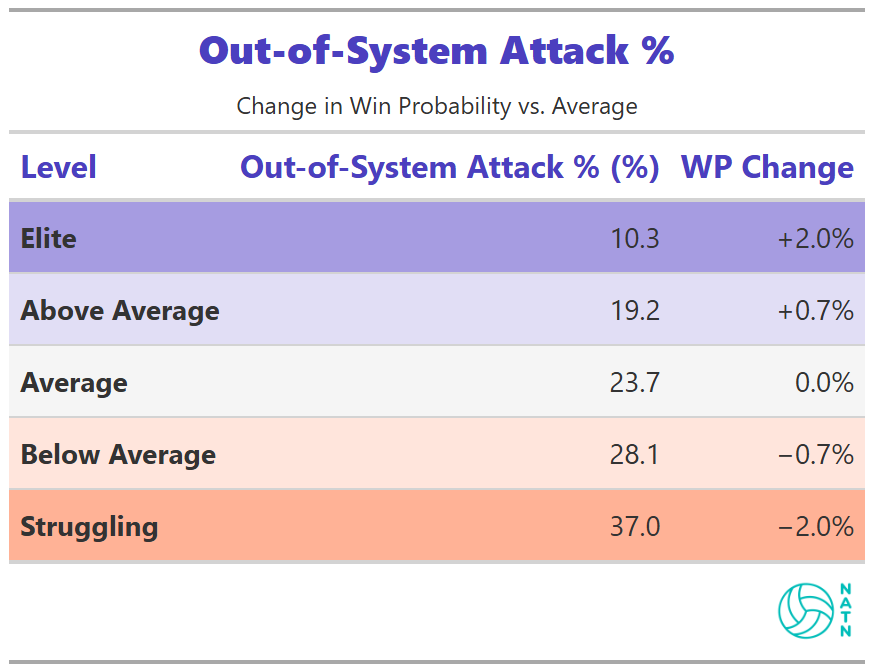
Out-of-system attack percentage shows a weaker, flatter relationship than most coaches would expect.
Being out of system carries a cost, but that cost varies. Elite teams have built enough margin elsewhere—better attackers, better decision-making, better ball control—that they can absorb occasional out-of-system swings without catastrophic consequences.
For teams without that margin, the cost is steeper. An out-of-system swing that comes back isn’t just a lost opportunity—it’s a chance for the opponent to counter and take control.
The model reflects that variability rather than enforcing a uniform penalty.
Opponent Pass Rating
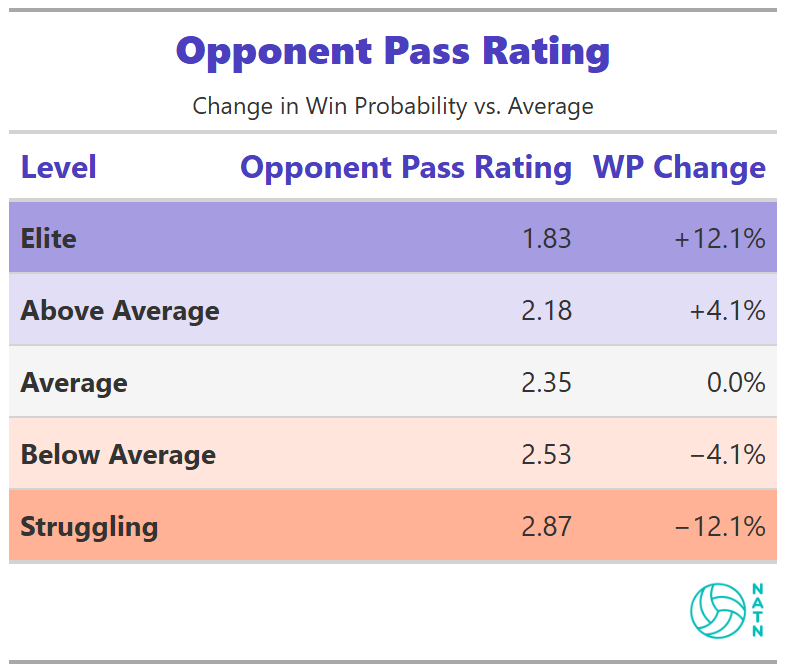
As opponent pass rating declines, estimated win probability increases. The relationship is consistent but smaller than many coaches expect.
That makes sense. Your opponent’s pass rating only matters if you can capitalize on it. If they pass poorly but you can’t transition into quality offense—because your block isn’t creating opportunities or your defense can’t stay in system—you’ve wasted the leverage.
On its own, forcing poor passes provides limited advantage. Paired with strong transition defense, it compounds.
Reading the Tables Together
Reading any one of these tables in isolation misses the point.
They describe constraints that interact, not levers to be maximized. Improvements in one area may offset limitations in another. Costs accumulate unevenly across rosters.
The model’s value is in making those tradeoffs harder to ignore.
Where We Go From Here
This model tells us what tends to matter across Division I volleyball. What it refuses to tell us is how any one team should play.
That isn’t a limitation—it’s the point.
Winning isn’t about maximizing every metric at once. It’s about choosing which costs you’re willing to absorb, given your roster, your margin, and your tolerance for risk. The model doesn’t give answers. It removes excuses.
The next step is understanding why it behaves this way. That’s where methodology matters—not as an academic exercise, but as a way to see which conclusions are sturdy and which are context-dependent. That work comes next, and it’s necessarily technical.
Once that foundation is clear, the work gets more practical.
We’ll use this framework to look at different team styles and ask what leverage actually looks like for each of them. What the model rewards for teams that win with pressure versus teams that win with margin. How the same constraints show up differently across rosters. And what changes when you stop asking whether a skill is “good” and start asking what it buys this team.
From there, the implications get uncomfortable in a different way. Standards don’t just shape evaluation—they shape training and recruiting. If access to an in-system offense is where leverage lives, then the way teams allocate reps, design drills, and value contacts starts to look different. Not universally different. Specifically different.
This model describes the landscape. The pieces that follow are about navigating it—first by understanding the terrain, then by choosing where you’re actually willing to step.
Brilliant breakdown on how in-system digs actually create offensive leverage. The 70-point gap in win probability between low and high in-system dig percentage is wild, but it tracks with what I've seen coaching at lower levels where teams obsess over kill percentages but ignor the quality of transition. Curious if the model tested for interaction effects between freeball generation and opponent attackquality, since forcing a freeball off an elite hitter seems way more valuable than off a middling one.